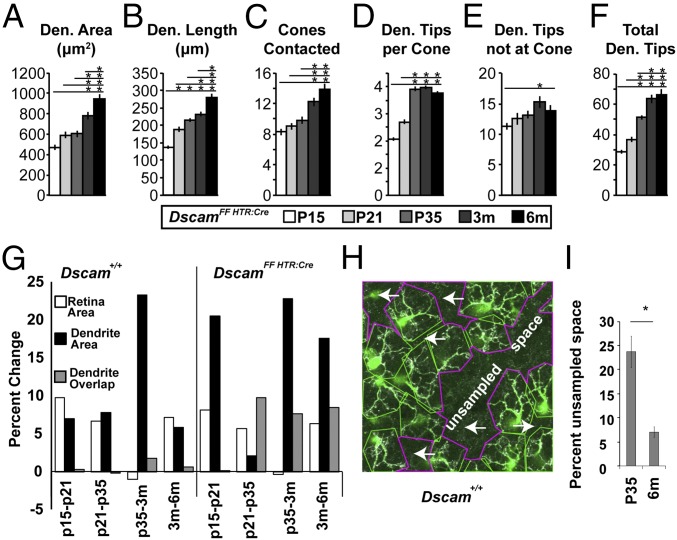
Fig. 4.
Dendrite growth dynamics. (A–F) Quantification of DscamΔflox BC4 characteristics at P15, P21, P35, 3 mo, and 6 mo. Significant increases in all measurements were detected (ANOVA P values: A–D, and F: P < 1.3 × 10⁻¹²; E: P = 1.4 × 10⁻²). Horizontal lines above columns in A–F represent comparisons between the column under the left end of the line and all columns to the right. An asterisk above a point on the line represents a post hoc significance test value, indicating a significant difference between the left-most column under the line and the column under the asterisk. Traced cells: n = 30, 30, 40, 40, and 30 at P15, P21, P35, 3 mo, and 6 mo, respectively. Error bars = SEM. DscamΔflox data included also in Figs. 2 and 3. (G) Graphs showing the percent change between the means for successive time points for retina area and dendrite area and the difference between the means for successive time points for dendrite overlap. (H and I) Percent unsampled space (H, arrows) was reduced between P35 and 6 mo. (t test P = 4.9 × 10⁻⁴, H scale, 106 μm × 106 μm, n = 10 images per age.) Den., dendrite; m, month; P, postnatal day.

