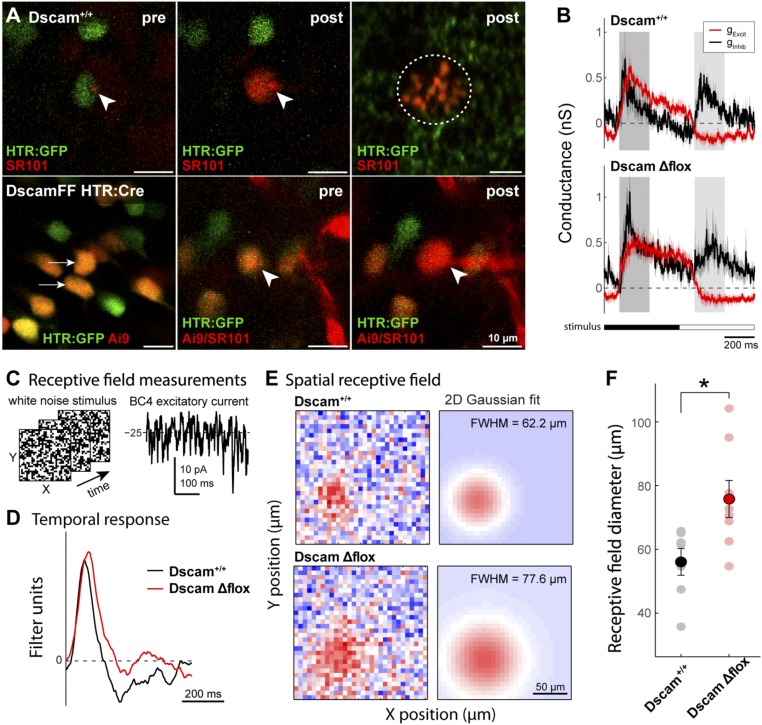
Fig. 6.
BC4s lacking DSCAM have enlarged visual receptive fields. (A) Two-photon fluorescence images of genetically identified bipolar cells in the whole-mount retina in vitro. (Upper) HTR:GFP expressing bipolar cells (green) were targeted for electrophysiological whole-cell recording. Intracellular solution contained fluorescent dye, sulforhodamine 101 (SR101, red) to confirm cell type based on dye fill at the level of the soma (Center) and axonal arbor (Right, red circled). (Lower) HTR:GFP and Ai9 coexpressing cells in the DscamFF HTR:Cre retina (arrows) were targeted for recording as in Dscam+/+. Arrowheads indicate the pipette tip at the recorded cell. post, image after recording; pre, image before recording. Abundant Ai9 expression in DscamFF HTR:Cre mice precluded verification of axonal arbor from dye fills. (B) Plots of the light-evoked excitatory (red) and inhibitory (black) conductance in Dscam+/+ (Upper) and DscamΔflox BC4s (Lower) during stimulation with a contrast modulated spot on a gray background (100-µm diameter; time course shown at bottom). OFF and ON-evoked conductances were quantified by averaging over the time windows indicated by the shaded bars; see Results for details. (C) BC4 visual receptive fields were measured using white-noise checkerboard stimuli. (Left) Example stimulus frames; (Right) example response segment. (D) Temporal response of example Dscam+/+ and DscamΔflox BC4s, computed by cross-correlating the white-noise evoked response and the visual stimulus. No significant difference was detected comparing OFF or ON excitation or inhibition; OFF excitation: 0.41 ± 0.11 (WT) vs. 0.39 ± 0.05 (DscamΔflox) nS; ON excitation: −0.09 ±0.06 (WT) vs. −0.16 ± 0.05 (DscamΔflox) nS ; OFF inhibition: 0.48 ± 0.03 (WT) vs. 0.26 ± 0.11 (DscamΔflox) nS; ON inhibition: 0.37 ± 0.12 (wt) vs. 0.24 ± 0.03 (DscamΔflox) nS; n = 4 Dscam+/+, 5 DscamFF HTR:Cre; t test, P = 0.89, 0.40, 0.06, 0.39. (E) Spatial receptive field maps (Left) of example Dscam+/+ and DscamΔflox BC4s, computed by cross-correlating the white-noise evoked response and the visual stimulus. Receptive field size was quantified using 2D Gaussian fits to the spatial receptive field at the peak response (∼85 ms). Receptive field diameter is expressed as full width at half maximum of the Gaussian fits (FWHM = 2.36 s). A significant increase in the receptive field of DscamΔflox BC4s was observed compared with Dscam+/+ BC4s (35.1% increase; FWHM of Gaussian fit: 75.8 ± 5.81, n = 8 vs. 56.1 ± 4.18 µm, n = 7; mean ± SEM; t test, P = 0.019). (F) Receptive field diameters for the recorded BC4 population (Dscam+/+ n = 7; DscamΔflox n = 8; *P = 0.019).

