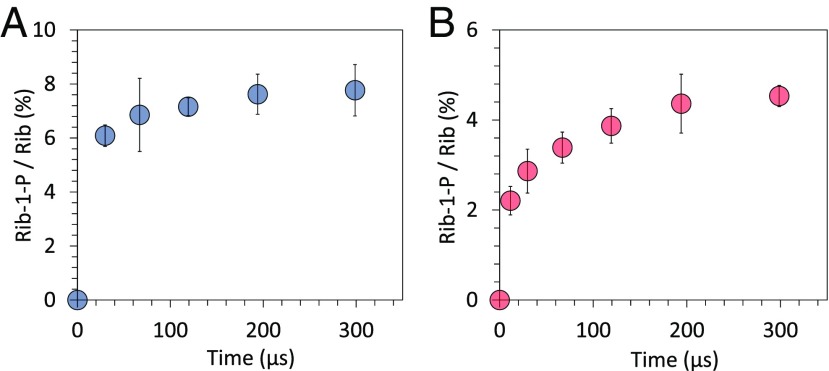
Fig. 2.
Progression of the phosphorylation reaction between d-ribose and phosphoric acid in charged and uncharged aqueous microdroplets. Time-course changes in the ion count ratio between d-ribose-1-phosphate and unreacted d-ribose in (A) charged and (B) uncharged microdroplets. Error bars represent 1 SD from triple measurements.

