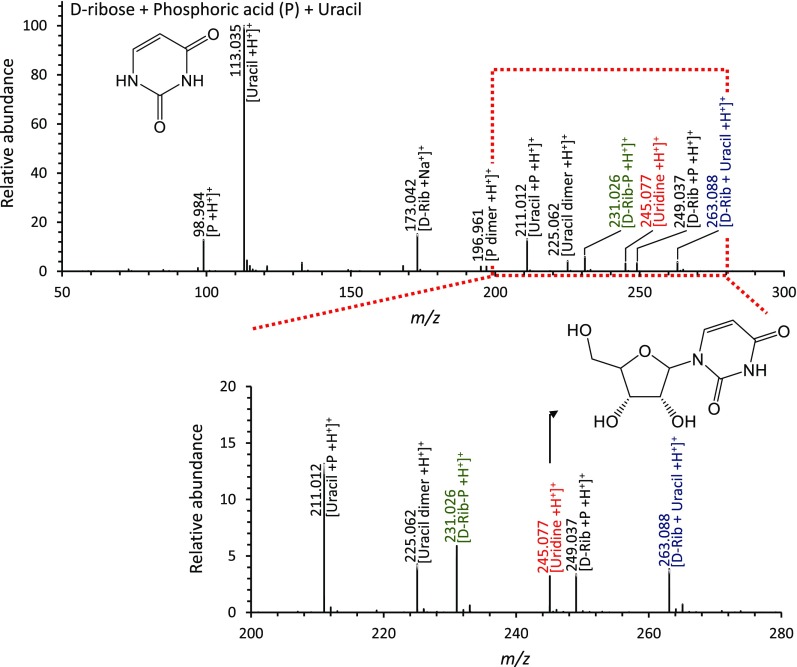
Fig. 4.
Mass spectra of the products from ribosylation reaction of uracil with ribose and phosphoric acid in microdroplets. The m/z peak of protonated uridine is in red, the protonated complex of d-ribose with uracil is in blue, and the protonated ribose-phosphate intermediate is in green. The black numbers and letters denote species in the reactants.

