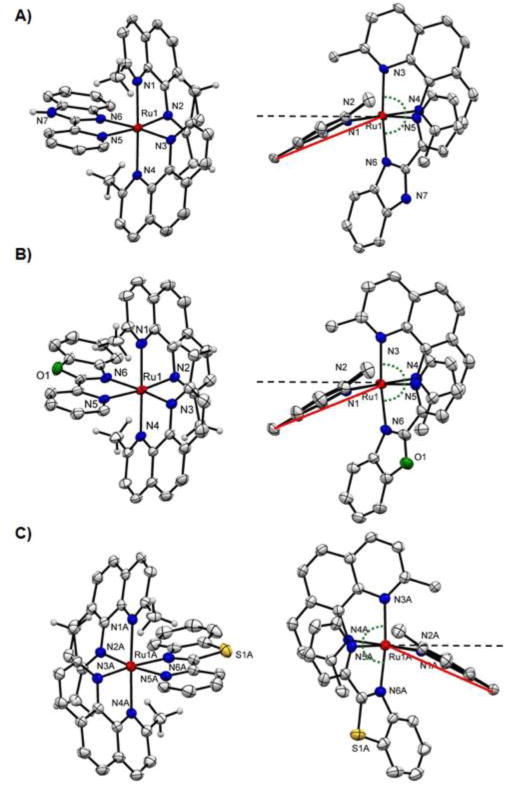
Figure 1.

Ellipsoid plot of ruthenium complexes A) (Δ)-6, B) (Δ)-7, C) (Λ)-8 at 50% probability with H atoms omitted for clarity. Right column: side views highlighting the distortion of the dmphen ligand. The black dashed lined indicates the normal plane and the angle between red and black dash line represents the ligand bend. Note: for 8 only one cation of the asymmetric unit is shown.
