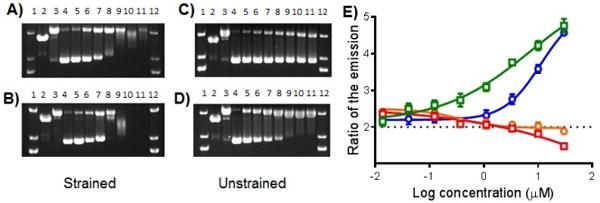
Figure 5.

Agarose gel electrophoresis of 40 μg/mL pUC19 plasmid (10 mM phosphate buffer, pH 7.5) with light-activated Ru(II) compounds. Dose response profiles: (A) 6; (B) 8; (C) 10; (D) 12; Lanes 1 and 12, DNA molecular weight standard; lane 2, linear pUC19; lane 3, relaxed circle (Cu(phen)2 reaction with pUC19); lanes 4−11, 0, 7.8, 15.6, 31.25, 62.5, 125, 250, and 500 μM compound. E) Singlet oxygen generation dose responses of ruthenium complexes: 6 (circles, orange line); 8 (squares, red line); 10 (circles, blue line); and 12 (squares, green line). (n = 2). The data is shown as a ratio of the emission of the sensor after irradiation with the compound vs. without irradiation. The slight downward curve for 8 suggests this compound quenches singlet oxygen at high doses.
