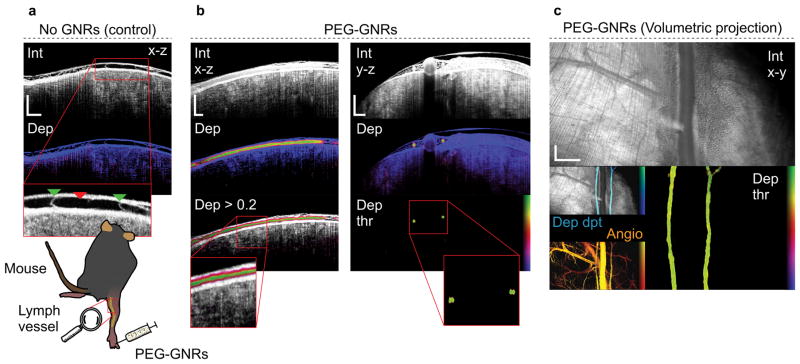
Figure 5. Gold nanorod transport in mouse lymphatic vessel (in vivo).
a, Control measurement showing depth resolved view (x–z) of intensity and depolarization. The lymph vessel (red triangle) and vessel valves (green triangles) are highlighted in the magnified view. b,c, Mouse lymphatic vessel after injecting 10 μL of 36 nM PEG-GNRs into the foot. Imaging was performed 2 minutes postinjection. b, Depth-resolved views (x–z and y–z) showing intensity and depolarization. The lymphatic vessel is outlined in the depolarization view. c, Volumetric projections (x–y) over all depths showing intensity (Int), depolarization > 0.3 (Dep thr), intensity overlaid with depth-encoded depolarization (Dep dpt) and angiography (Angio). Depth-encoded depolarization (Dep dpt) displays superficial regions as bright blue and deeper regions of depolarization as dark blue. Depth span, 1.2 mm. Angiography (Angio) is displayed for comparison. The angiogram (Angio) contrasts moving scatterers (flow) from a static background. Superficial vessels are presented in yellow and deeper vessels are presented in red. Depth span, 1.5 mm. Scale bars, 500 μm (a,b), 1 mm (c). Supplementary Media 3.

