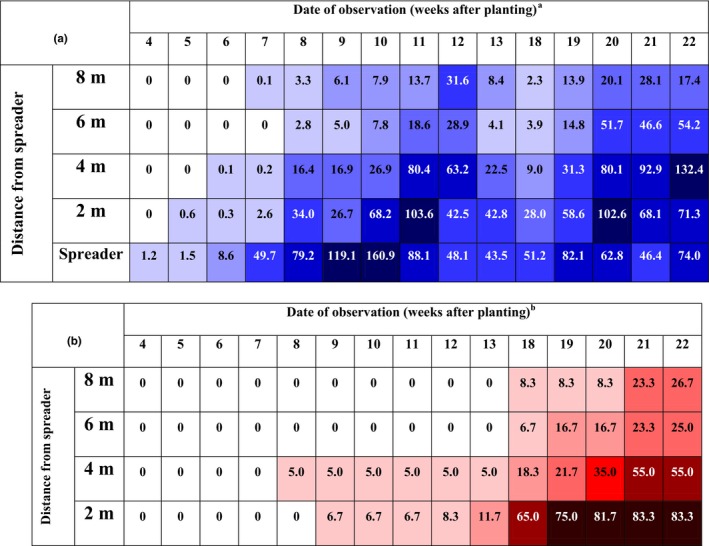
Figure 1.

Spatiotemporal distribution of Bemisia tabaci (a) and cassava brown streak disease (b) on initially disease‐free cassava plants under screenhouse, Kibaha, Tanzania, shown as a heat map. aValues in boxes are mean numbers of adult B. tabaci per plant. The figure is a heat map ‐ the increased intensity of the colour indicates increased number of B. tabaci adults per plant. bValues in the boxes are percent CBSD incidence. The figure is a heat map ‐ the increased intensity of the colour indicates increased CBSD incidence [Colour figure can be viewed at wileyonlinelibrary.com]
