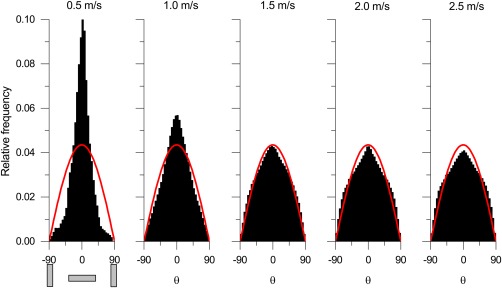
Figure 10.

Distribution of the inclination angle for the intermediate rods at different excess gas velocities.
The red lines indicate the random distribution for a sphere.25 Orientations of 0 and ±90° are indicated below the first figure. [Color figure can be viewed at wileyonlinelibrary.com]
