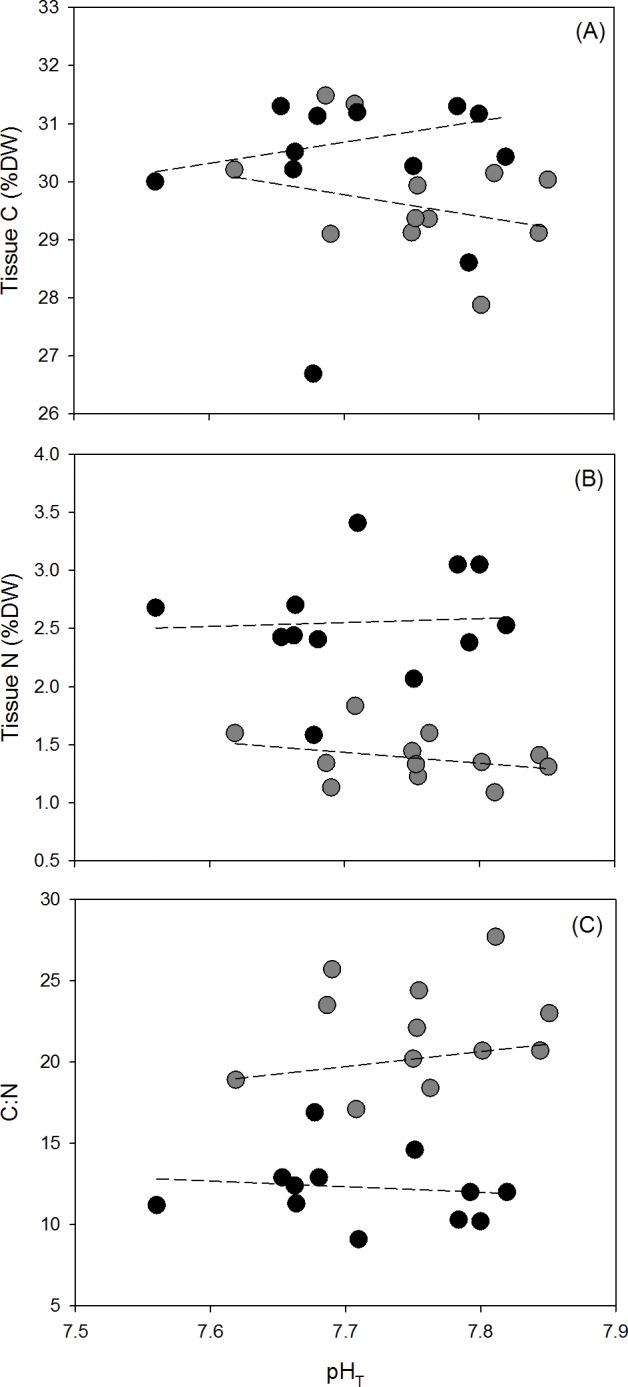
Fig 6.

(A) Tissue C (%DW), (B) tissue N (%DW), and (C) C:N ratio of samples of Ulva australis under ambient and enriched NH4+ treatments across a range of pHT. Grey points represent ambient NH4+ treatments and black points represent enriched NH4+ treatments. The slopes of tissue C, tissue N, and the C:N ratio with decreasing pHT for each NH4+ treatment (dashed lines) were tested for an interaction using an ANCOVA.
