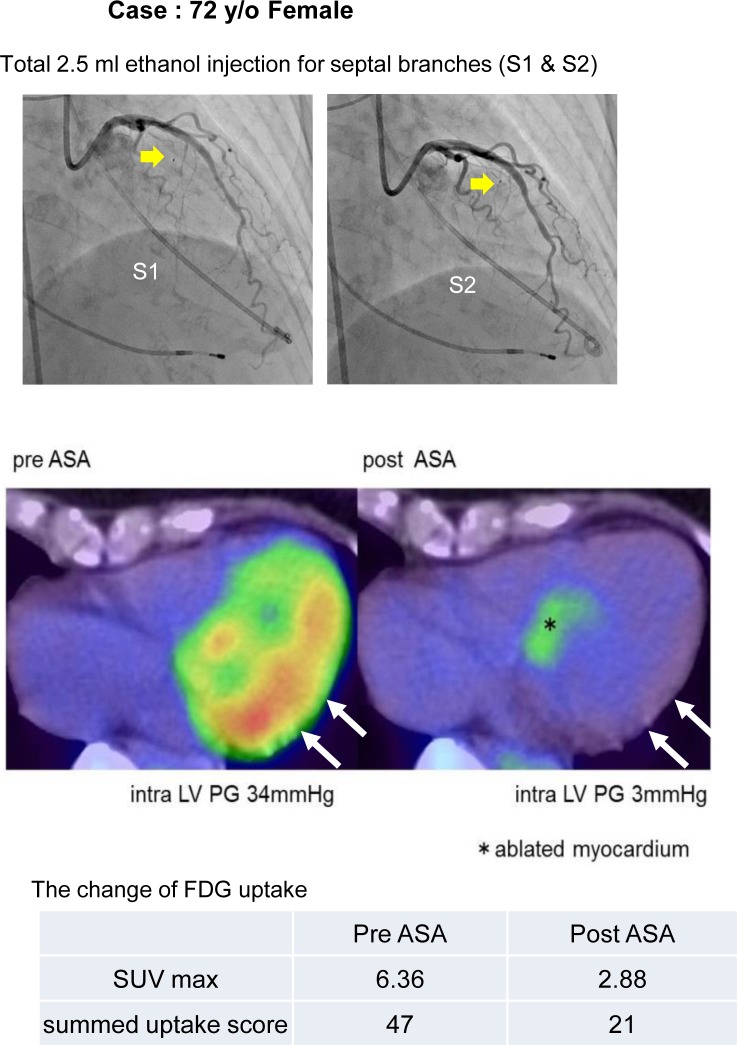
Fig 3. A representative case of ASA.
Images of serial 18F-FDG-positron emission tomography (PET)/computed tomography (CT) in a representative case of an HOCM patient who received alcohol septal ablation therapy (ASA). Ablated septal branches are indicated with yellow arrows in the upper panels. In the middle panels, long axis trans-vertical LV views of 18F-FDG-PET /CT before and after ASA are shown. An ablated myocardium is indicated with a star symbol, and the portion with a significant reduction of 18F-FDG uptake in the lateral and posterior LV wall is indicated with white arrows. In the lower table, the changes of the maximum standardized uptake value (SUV max) and summed uptake score are shown.

