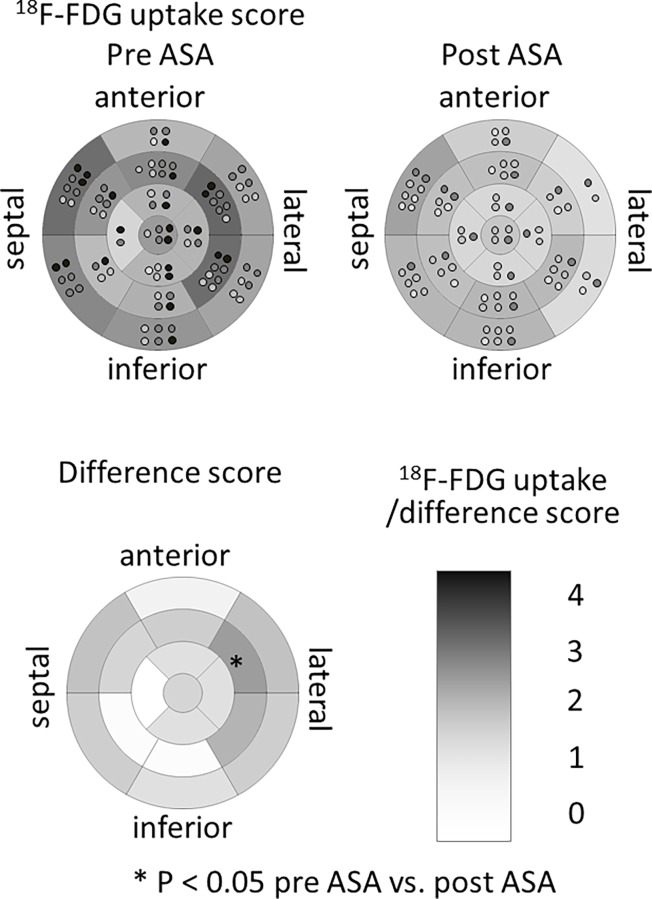
Fig 4. Change of 18F-FDG uptake score after ASA.
Mean uptake score of 18F-FDG before and after ASA and difference score at each LV 17-segment. The mean uptake score was calculated with a semi-quantitative scoring method for each segment. Light gray dot indicates the individual with slight uptake, middle gray dot mild uptake, dark gray dot moderate uptake, and black dot dense uptake. The difference score was calculated by subtracting the post-value from the pre-value for each segment. The values were expressed by the density of gray color. * P<0.05 between pre- and post-ASA uptake score.

