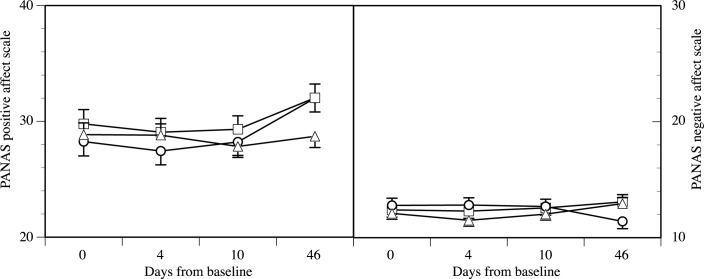
Fig 2. Changes in PANAS positive and negative affect scale scores over time in all experimental groups (Causality group: ○, Reversed causality group: □, Control group: △).
Please note the differences in scaling between positive and negative affects scores and that the minimum score for both scales is 10.

