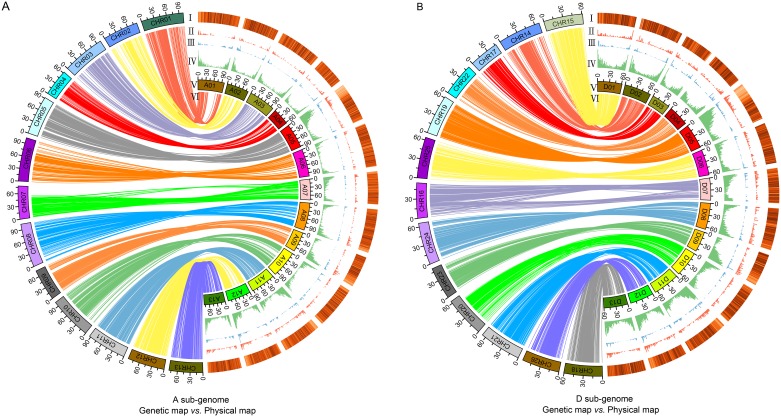
Fig 1. Collinearity of the genetic and physical maps and genomic distribution of TEs, markers, recombination rate and genes on each chromosome.
Collinearity of the genetic and physical maps and genomic distribution of TEs, markers, recombination rate and genes on each chromosome in At (A) and Dt (B). (A, B)I-IV: The genomic distribution of TEs, markers, recombination rate and genes on each chromosome are shown in heat map, red bar graphs, blue bar graphs and green bar graphs;V: The chromosomes;VI: Collinearity of the genetic and physical maps.

