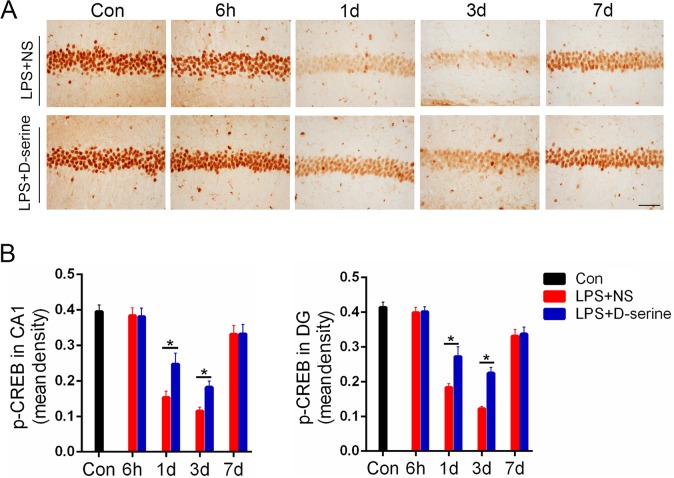
Fig 4. Activation of NMDA receptors with D-serine obviously limited the decrease of p-CREB in the hippocampus of the surviving LPS-treated mice.
(A) Images of the p-CREB staining, Bar = 50μm. (B) The relative mean optical densities for p-CREB staining in the CA1 and dentate gyrus. Data are expressed as the mean ±S.D.*P<0.05 LPS+NS vs. LPS+D-serine for corresponding time points after LPS i.p. (n = 5 per time point per group).

