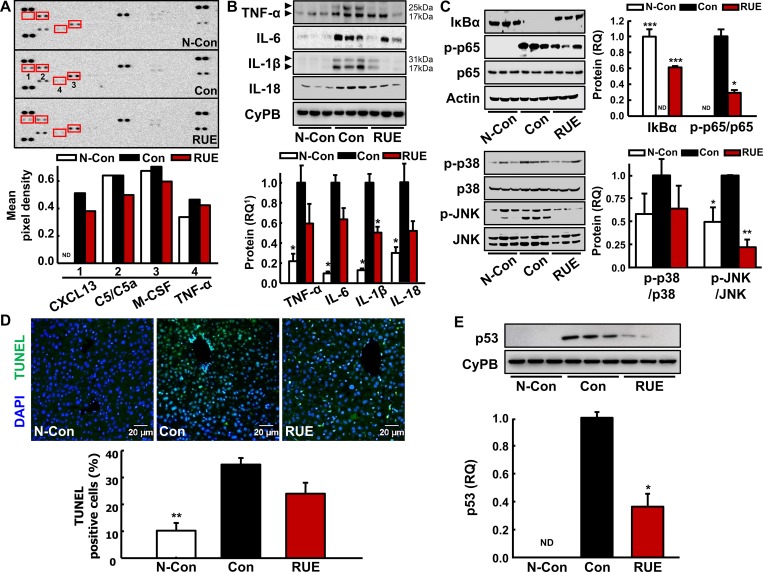
Fig 3. RUE decreases expression of inflammatory cytokines through MAPK-NF-κB pathway.
(A) Inflammatory cytokines levels in serum were analyzed using mouse cytokine antibody array. A graph depicting the mean pixel density of dot blots; (B) Immunoblot analyses of inflammatory cytokines (TNF-α, IL-6, IL-1β, and IL-18) in the liver tissue with the loading control CyPB. All data are presented as the mean ± SEM. (*P < 0.05 vs. control); (C) Immunoblot analyses of p38 and JNK MAPK-NF-κB inflammatory pathway. Actin, non-phosphorylated p65, p38, and JNK were examined as the loading controls, and a graph depicting the quantification of the relative abundance of the genes is shown. All data are presented as the mean ± SEM. (*P < 0.05; **P<0.01; ***P<0.001 vs. control). Not detected bands were indicated as ND in the quantifications; (D) Representative images of terminal deoxynucleotidyl transferase dUTP nick end labeling (TUNEL) assay in the liver tissue (200× magnification). TUNEL-positive cells were detected by immunofluorescence analysis. Histograms represent the quantification of fluorescein isothiocyanate-labeled nucleus over the total number of nucleus. Data are presented as the mean ± SEM. **P<0.01 vs. control); (E) Immunoblot analysis of p53 with the loading control CyPB. Data are presented as the mean ± SEM. (*P < 0.05 vs. control). 1RQ, relative quantity.

