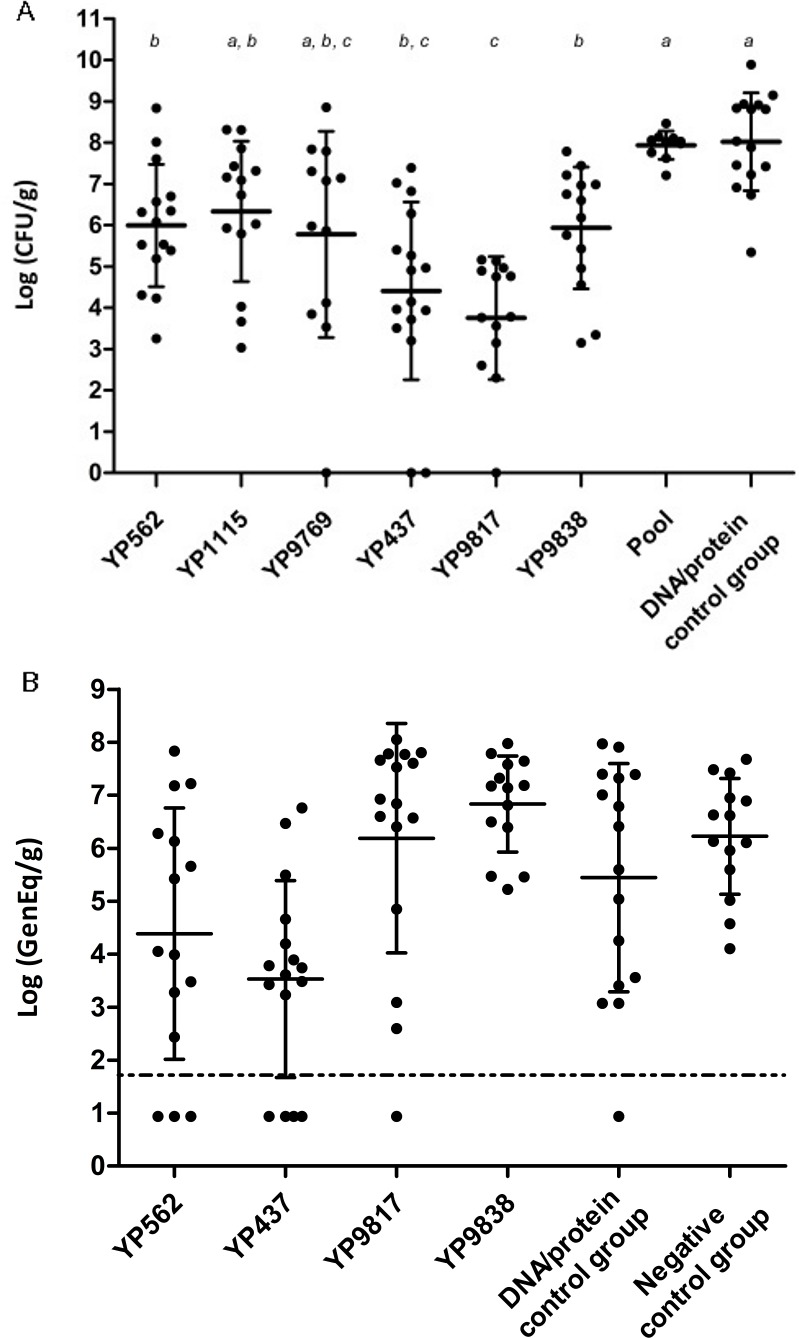
Fig 2. Campylobacter loads in chicken ceca after vaccination and challenge.

After two vaccinations on days 5 and 12, chickens were then orally infected on day 19. Campylobacter counts were evaluated at the end of the experiment from ceca samples. (A) YP562, YP1115, YP9769, YP437, YP9817, and YP9838 antigens were individually injected in the first experiment along with a combination of antigens (Pool) and compared to a DNA/protein control group (injected with adjuvants only). Ceca samples were cultured on mCCDA for Campylobacter counts (Log CFU/g). Groups without common letters (a-c) differed significantly (p < 0.05). (B) Four antigens (YP562, YP437, YP9817, and YP9838) were tested again in a second experiment and compared to DNA/protein control group (injected with adjuvant only) and negative control group administered with PBS only. Quantitative PCR on ceca samples was used for Campylobacter counts (Log GenEq/g). The detection limit was determined to lie at 1.88 log10 GenEq/g. Samples with counts under the threshold were set at 0.94 log10 GenEq/g. No significant differences were observed between groups.
