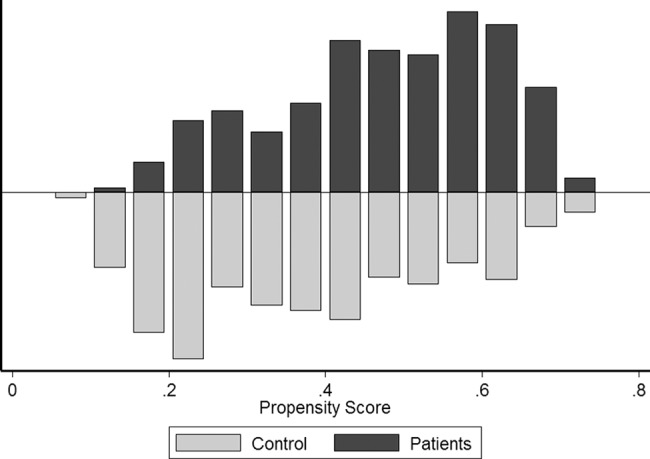
Fig 1. Propensity score distribution in MS patients and controls.

Patients and controls were matched using a propensity score with nearest neighbor pair matching without replacement within specified calipers (width of 0.2). 1000 bootstrap simulations were then performed.
