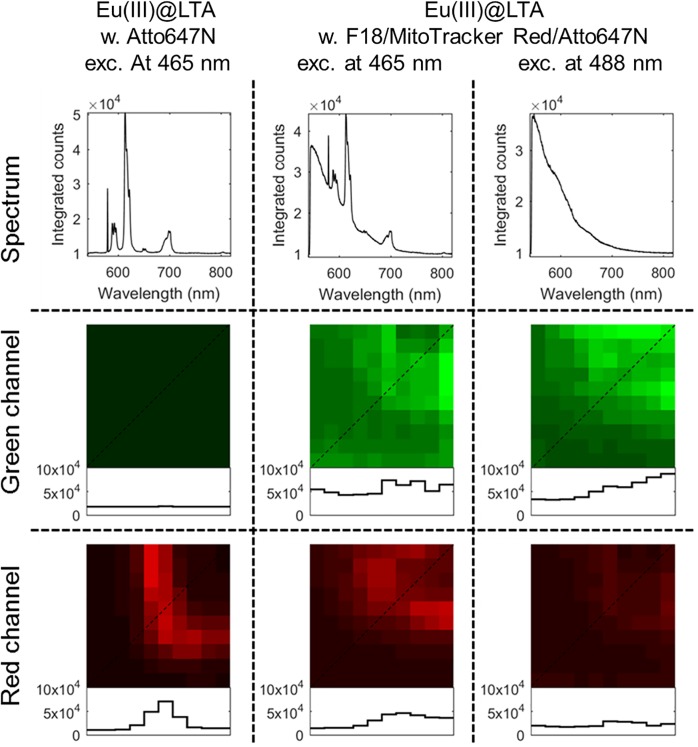
Fig 4. Model system for the scanning confocal fluorescence microscopy.
Total intensity spectra and confocal fluorescence microscopy images of Eu(III)@LTA with ATTO467N in the PVA film following 465 nm excitation and Eu(III)@LTA with F18, MitoTracker Red, and ATTO467N in the PVA film following excitation at 465 nm or at 488 nm monitored through a green bandpass filter (539–556 nm) or a red bandpass filter (604–644 nm) of an Edmund Optics filter kit. The profiles of the diagonal lines (dotted) through the images are plotted beneath showing the pixel intensities.

