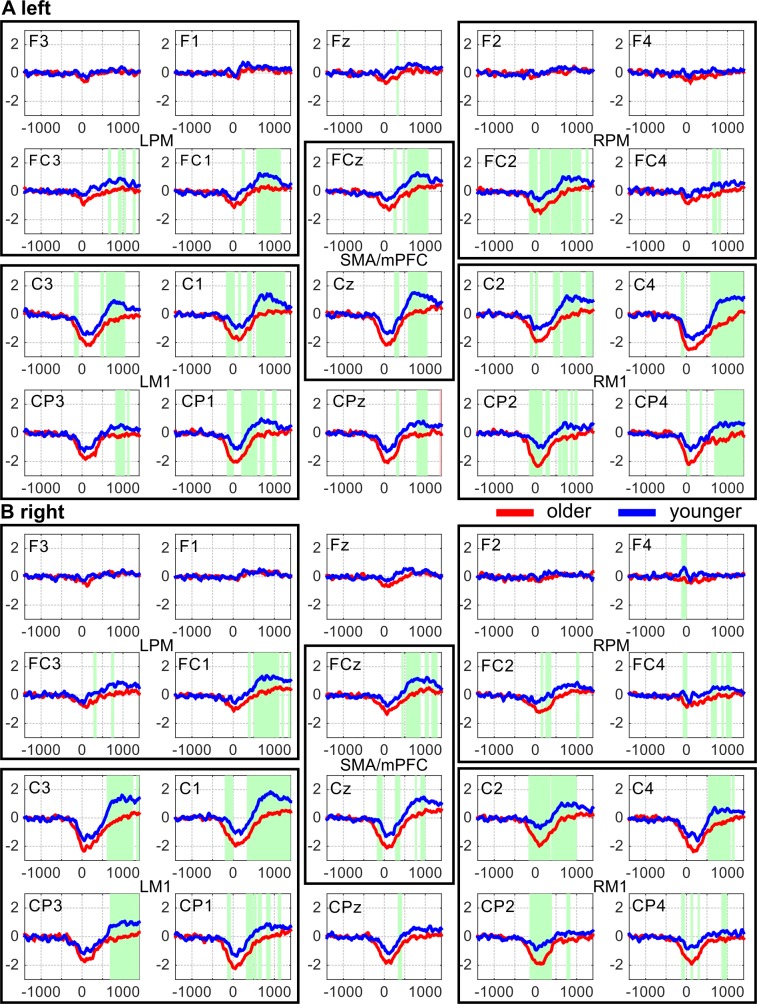
Fig 6.
Amplitude averaged over the β (13–30 Hz) frequency band in visually-cued left (A) and right index finger tapping (B) in both younger (blue lines) and older (red lines) subjects at the electrodes of interest that label the panels. The horizontal axis is the time in the interval [–1400, 1400] ms. The vertical axis shows the size of the amplitudes. In the time intervals marked with green, the amplitudes in the younger subjects are significantly higher (p<0.0085, FDR corrected) than those in the older subjects. LPM and RPM denote left and right premotor cortex, LM1 and RM1 left and right primary motor cortex, respectively. SMA stands for the supplementary motor area. Please note that FCz also detects activity from neural populations in the medial prefrontal cortex (mPFC).

