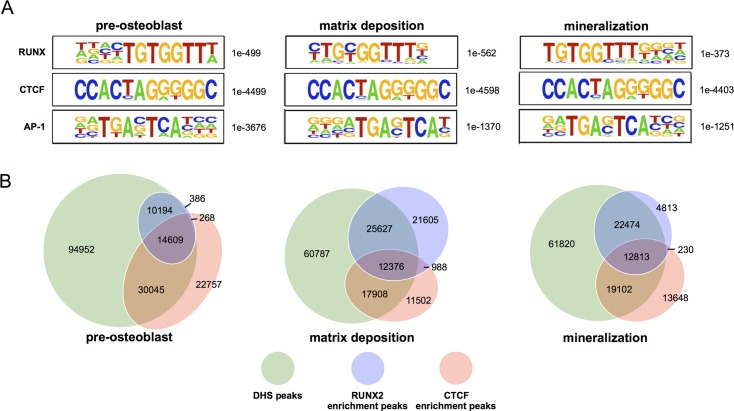
Fig 2. DHS sites highly overlap with RUNX2 and CTCF enriched regions.
(A) HOMER analyses identifying de novo discovered motifs within DHS sites of pre-osteoblasts (left column), matrix depositing osteoblasts (middle column), and mineralizing osteoblasts (right column). Among the highest motifs enriched at regulatory regions throughout differentiation are RUNX (top row), CTCF (middle row), and AP-1 (bottom row). Significance of motif enrichments is represented by p-values listed to the right of each motif logo. (B) Venn diagrams of DHS sites (green), RUNX2 enriched peaks (blue), and CTCF enriched peaks (red) at the three hallmark osteoblast stages. Values accompanying diagram portions reflect absolute peak counts.

