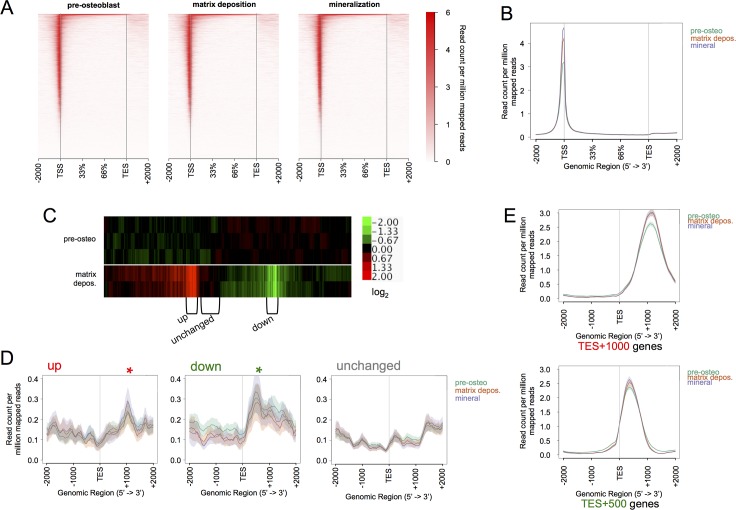
Fig 4. Regions proximal to the TSS exhibit the highest DHS signals, while regions 3’-flanking the TES display weaker but differential hypersensitivity signals.
(A) Heatmap representation of genome-wide DNase hypersensitivity peak signals displayed at gene bodies ± 2 kb with quantile distribution from TSSs to transcriptional end sites (TESs). The relative signal intensities at annotated gene bodies are stacked along the y-axis. Note that there are a multitude of weaker peaks found within gene bodies that contrast with the strong signals from peaks at the TSS. (B) Aggregation plot display of heatmaps showing the average read counts per million mapped reads of genome-wide DHS signals for pre-osteoblasts (green), matrix depositing osteoblasts (red), and mineralizing osteoblasts (purple) cultures. Shaded areas represent ± SE. (C) Heatmap of Affymetrix data showing differentially expressed genes in MC3T3 cultures between pre-osteoblast (n = 3) and matrix depositing osteoblast (n = 2) stages [7]. The scale bar of the log2-fold change in expression is displayed to the right. The average transcript detections of individual genes at d0 are used as baseline (scaled to 0.00). Brackets designate node-selection of gene clusters that encompass those that are ≥2-fold upregulated, ≥2-fold downregulated, and unchanged. (D) Aggregation plots of DHS signals at the TES ±2kb of the 300 genes classified as upregulated (left plot), 282 genes classified as downregulated (center plot), and 371 classified genes shown to not significantly change (right plot) between pre-osteoblasts and matrix deposition stage. Asterisks indicate peak signal averages aggregating at TES+1000 sequences (red asterisk), or TES+500 sequences (green asterisk). (E) Aggregation plots of all TES+1000 (765 genes) and TES+500 genes (829 genes) spanning the TES ±2kb at pre-osteoblasts (green), matrix depositing osteoblasts (red), and mineralizing osteoblasts (purple).

