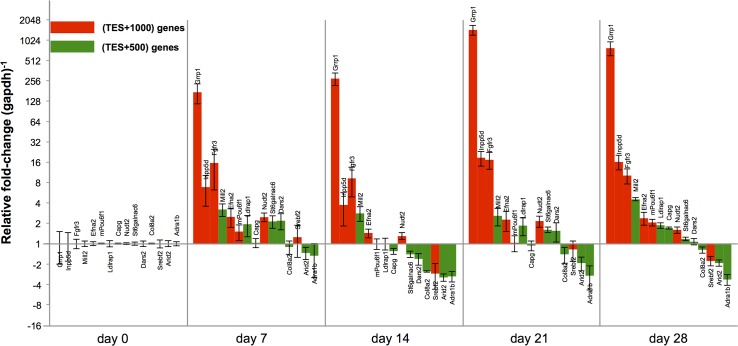
Fig 5. Relative-fold expression of selected genes throughout osteoblastogenesis.
15 genes displaying differential hypersensitivity at the TES were chosen from the TES+1000 (red) or TES+500 (green) gene list and subjected to RT-qPCR analysis at 7-day intervals throughout osteoblast differentiation of MC3T3-E1 cells (pre-osteoblasts, d7, d14, d21, and mineralizing osteoblasts). Relative-fold expression is represented as fold-change in message levels normalized to gapdh levels. Error bars represent ±SD.

