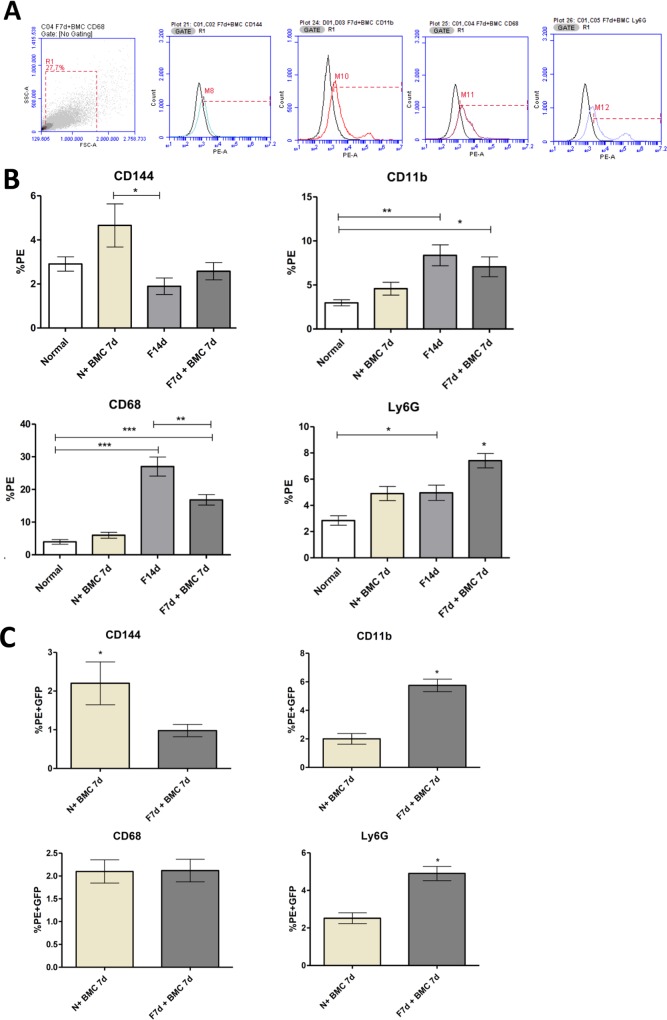
Fig 4. Characterization of total liver cells and transplanted GFP+ BMC.
(A) Forward scatter x side scatter graph showing typical morphological measurements of hepatic cells after enzymatic dissociation. The histograms show unstained cells (black curves) and stained cells to CD144, CD11b, CD68 and Ly6G antibodies (colorful curves). Quadrant chart shows double marking selection. (B) Immunophenotyping of total hepatic cells populations: CD144, CD68, CD11b and Ly6G. (C) Analysis of transplanted GFP+ BMC in the liver, described as the percentage of liver dissociated cells that emitted GFP fluorescence and marked to the antibodies CD144, CD68, CD11b and Ly6G. ***P = <0.0001, **P = <0.001 and *P<0.05.

