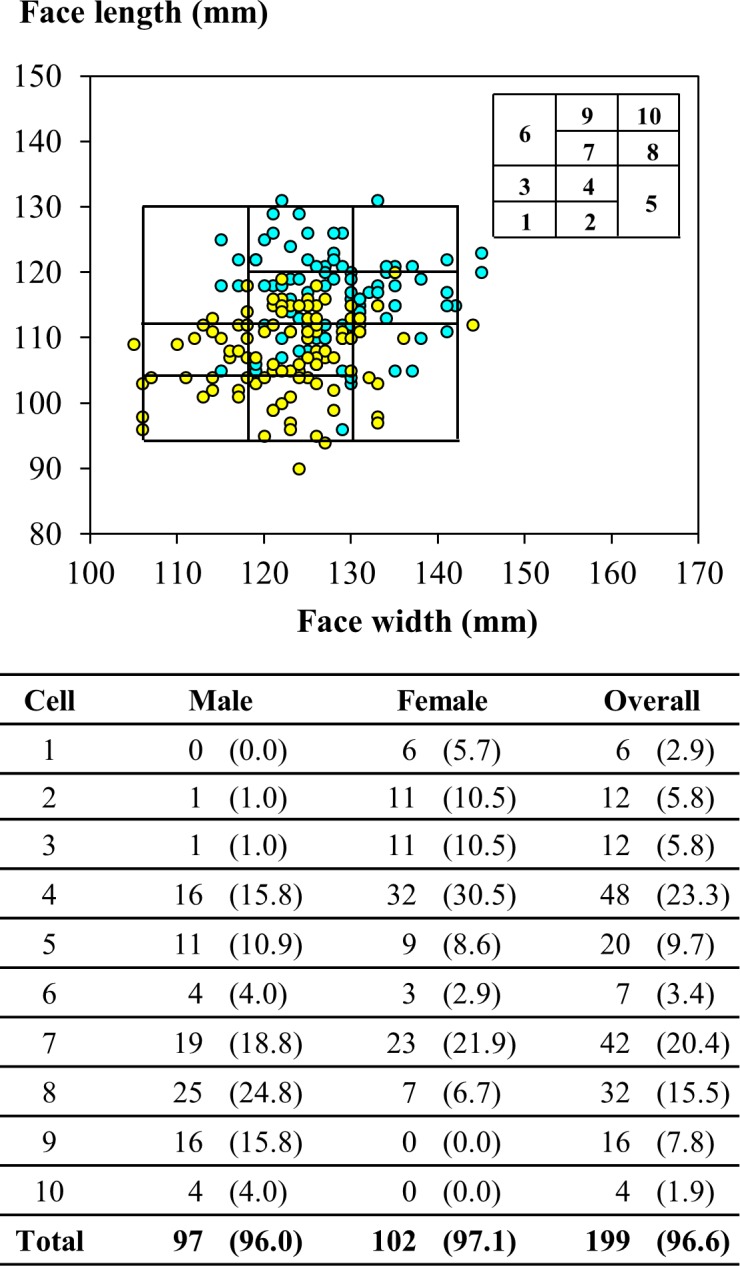
Fig 5. Facial dimensions of participants in panel of bivariate design developed this study.

Below the scatter plot of distribution are the numbers (percentages) of participants from this study in individual cells of respirator fit test panel. The cyan and yellow circles indicate values determined for male and female participants, respectively.
