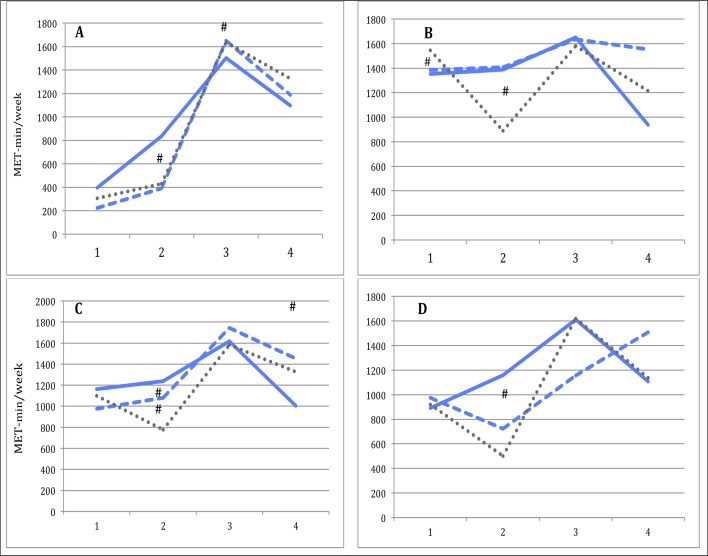
Fig 4. Total physical activity level measured between participants in the intervention group adherent and nonadherent to group-exercises and the control group.
1: time of inclusion, 2: gestational week 36, 3: 6 months postpartum, 4: 12 months postpartum. _____Blue; intervention adherent. -----Blue; intervention nonadherent. .....Dark grey; control group. A; Inactive; participants physically inactive at time of inclusion (<600 MET-min/week of MVPA). B; Active; participants physically active at time of inclusion (≥600 MET-min/week of MVPA). C; Normal weight; prepregnancy BMI < 25 kg/m2. D; Overweight/obese; prepregnancy BMI ≥ 25 kg/m2. # Statistically significant change in total physical activity level compared to time of inclusion, between intervention group adherent subgroup and control group (p<0.05).

