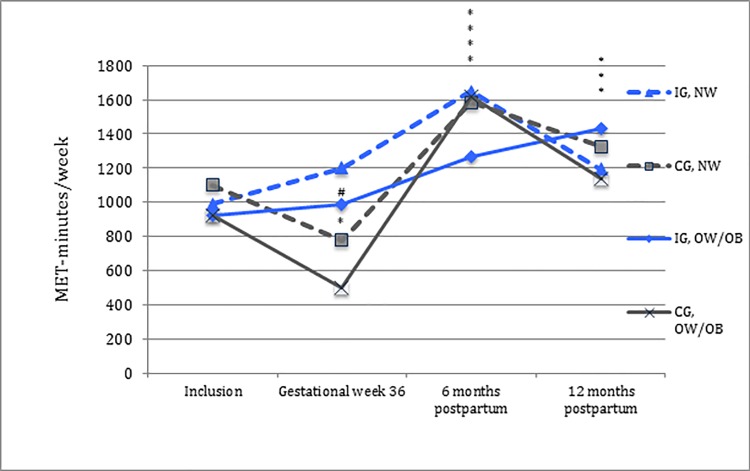
Fig 5. Total physical activity level in MET-minutes/week for the normal weight and the overweight/obese.
IG; intervention group. CG; control group. NW; normal weight. OW/OB; overweight/obese. - - - normal weight and _______ overweight/obese, blue = intervention group (IG) and dark grey = control group (CG). *Significant change in physical activity level compared to time of inclusion (p<0.05). #Significant difference in physical activity level between the intervention group and the control group compared to time of inclusion (p<0.05).

