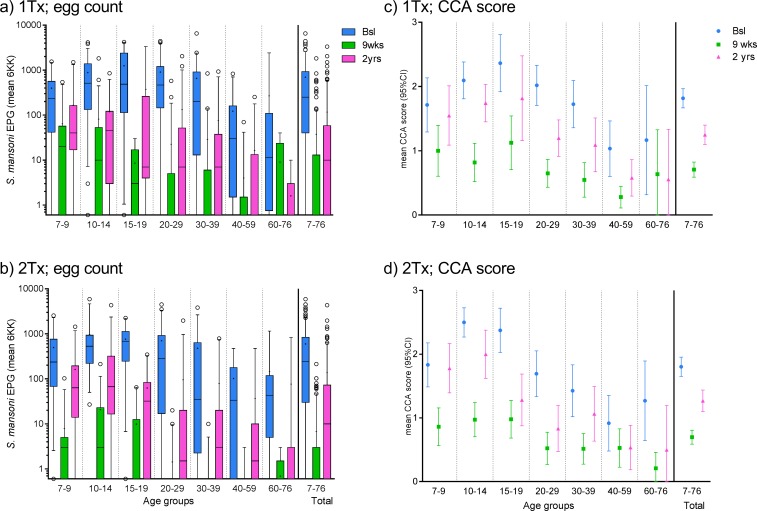
Fig 2. S. mansoni egg counts and CCA scores stratified by age groups and treatment arms.
a) and b) Boxplot with whiskers (5-95th percentile) showing S. mansoni EPG (mean of all obtained KK/individual) related to participant age for a) the one treatment arm (nbsl = 239, n9wks = 228, n2yrs = 186) and b) the two treatments group (nbsl = 206, n9wks = 200, n2yrs = 160) at three time points. Circles depict outliers. Medians are indicated with horizontal bars and the means with small “+”. The top and bottom of the box represent the 75th and 25th percentile respectively. c) and d) show mean CCA score ±95% CI stratified by age groups for c) the one treatment arm (nbsl = 238, n9wks = 211, n2yrs = 170) and d) the two treatments arm (nbsl = 206, n9wks = 188, n2yrs = 156) at three time points. The distribution for all samples per time point is shown at the far right on all subfigures.

