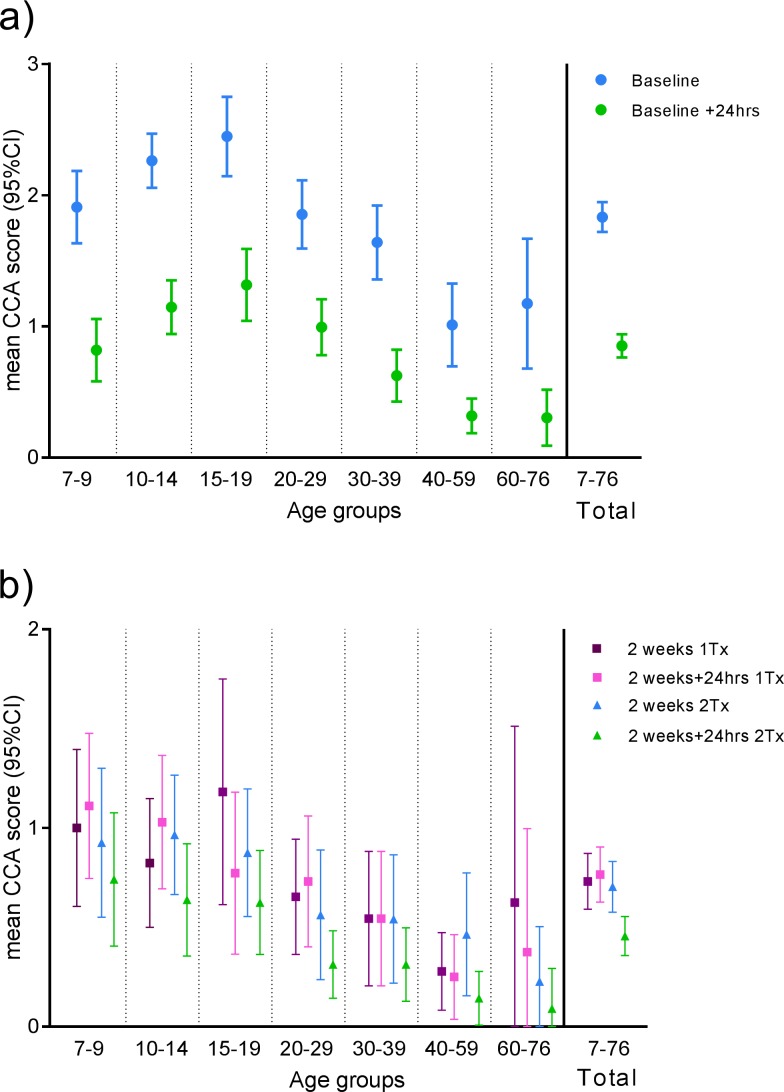
Fig 3. Short term CCA scores in response to treatment.
The mean CCA scores with 95% confidence intervals stratified by age groupings are shown for a) baseline and baseline+24hours (ntotal = 392) and b) two weeks and two weeks + 24hours further stratified by treatment regimen (n1Tx = 147, n2Tx = 157). Only individuals, who gave a urine sample at a time point (bsl and/or 2wks) and another sample at +24hrs, are included. “Trace” is included as score 0,5.

