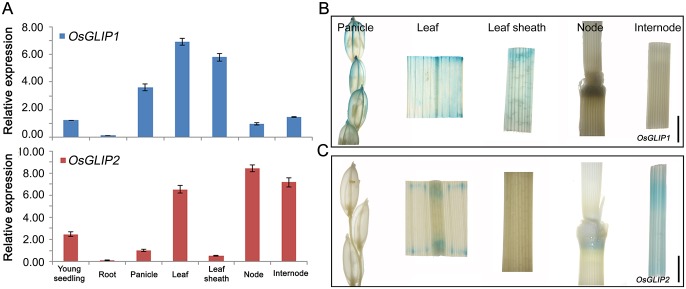
Fig 7. Expression patterns of OsGLIP1 and OsGLIP2.
(A) Tissue-specific expression of OsGLIP1 and OsGLIP2 in different tissues detected by qRT-PCR. The expression level of OsGLIP1 was normalized to that of young seedling and OsGLIP2 to panicle. Data shown are means ±SD from three biological replicates. (B, C) GUS staining of pOsGLIP1::GUS and pOsGLIP2::GUS transgenic plants revealed OsGLIP1 and OsGLIP2 expression in panicle, leaf, leaf sheath, node and internode of heading plants. Scale bars = 0.5 cm.

