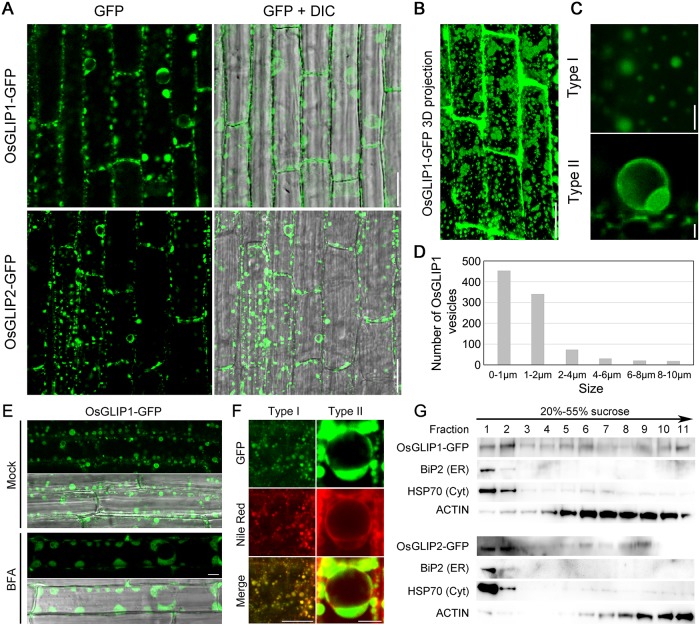
Fig 8. Subcellular localization of OsGLIP1 and OsGLIP2.
(A) Localization of OsGLIP1-GFP and OsGLIP2-GFP in the root cells of transgenic plants. OsGLIP1 and OsGLIP2 were fused with GFP and expressed under the control of the maize Ubiquitin (Ubi1) promoter in the stable transgenic rice plants. Scale bars = 20 μm. (B) A 3D projection of OsGLIP1-GFP fluorescence signals. Scale bar = 20 μm. (C) Images of OsGLIP1-GFP labelled vesicle-like structures (Type I and Type II). Scale bar = 2 μm. (D) Size distribution of OsGLIP1-GFP labelled vesicles. The size of vesicles is represented by the diameter. (E) The localization of OsGLIP1-GFP in response to BFA treatment, in comparison with mock treatment. Scale bar = 20 μm. (F) Co-localization of OsGLIP1-GFP with Nile Red that labels lipid droplets. Scale bars = 20 μm (left) or 5 μm (right). (G) Distribution of OsGLIP1-GFP and OsGLIP2-GFP proteins in fractionated membranes of two-week-old rice seedlings. Microsomal membranes were fractionated on linear 20% to 55% (w/v) sucrose gradients. Equal volumes of protein samples were separated on SDS-PAGE gel and analysed by immunoblot using antibodies specific for GFP (GLIP1/2-GFP), BiP2 (ER), HSP70 (cytoplasm) and ACTIN. Note that OsGLIP1 and OsGLIP2 mainly localize to the lipid bodies (cytoplasm) and the ER.

