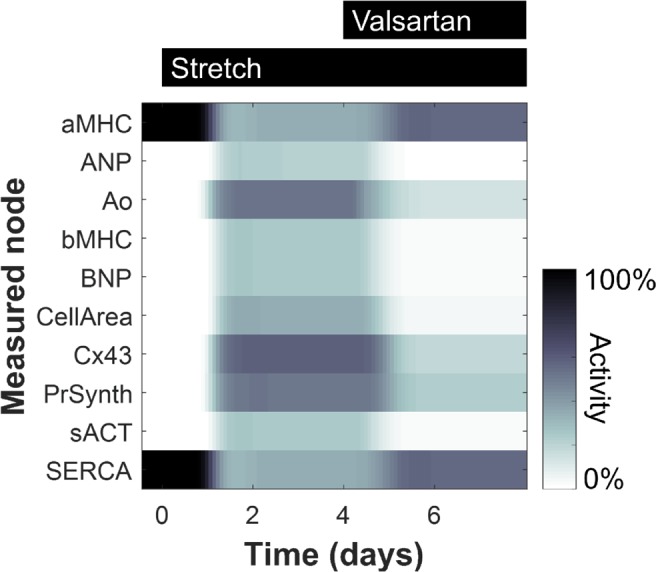
Fig 2. Predicted dynamics of model outputs.

Gene expression and phenotype levels are shown for 10 model outputs in response in response to cell stretching (starting at 20 min.) and valsartan (starting at 4 hrs.).

Gene expression and phenotype levels are shown for 10 model outputs in response in response to cell stretching (starting at 20 min.) and valsartan (starting at 4 hrs.).