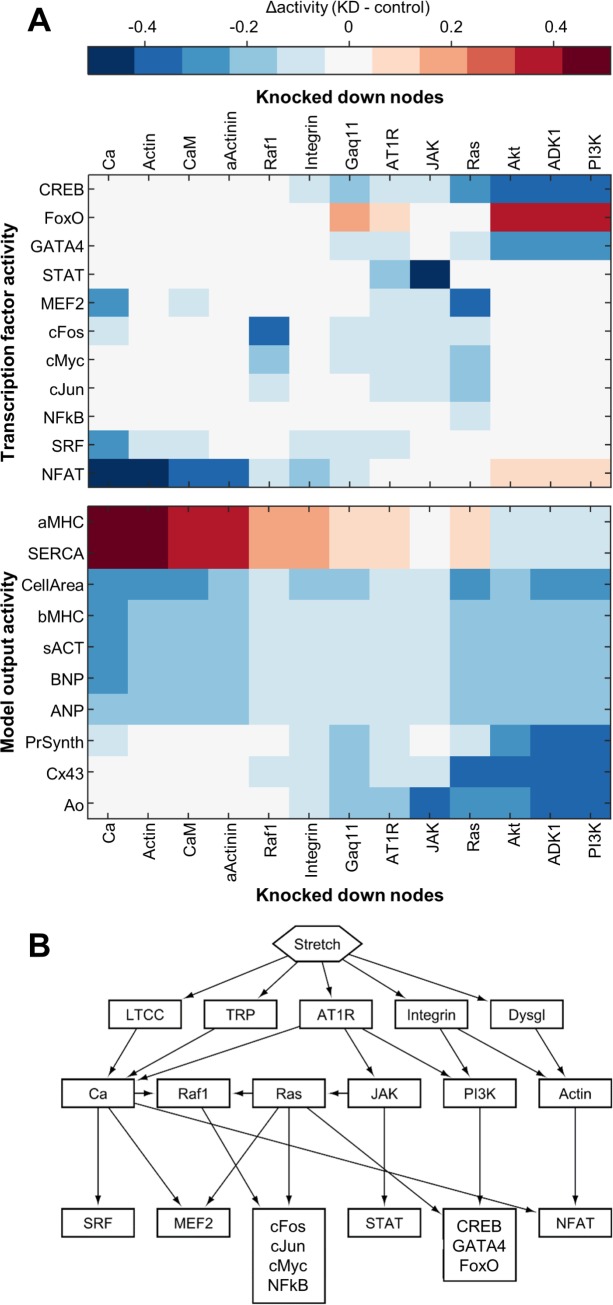
Fig 4. Sensitivity analysis reveals network structure.
(A) Network sensitivity to most highly influential hubs. Subset of the sensitivity matrix showing the response of each of the transcription factors and outputs to half-knockdown of each of the 12 nodes causing the highest average response across the transcription factors and outputs, as well as integrin. (B) Simplified network schematic showing control of transcription factors by 6 key hubs.

