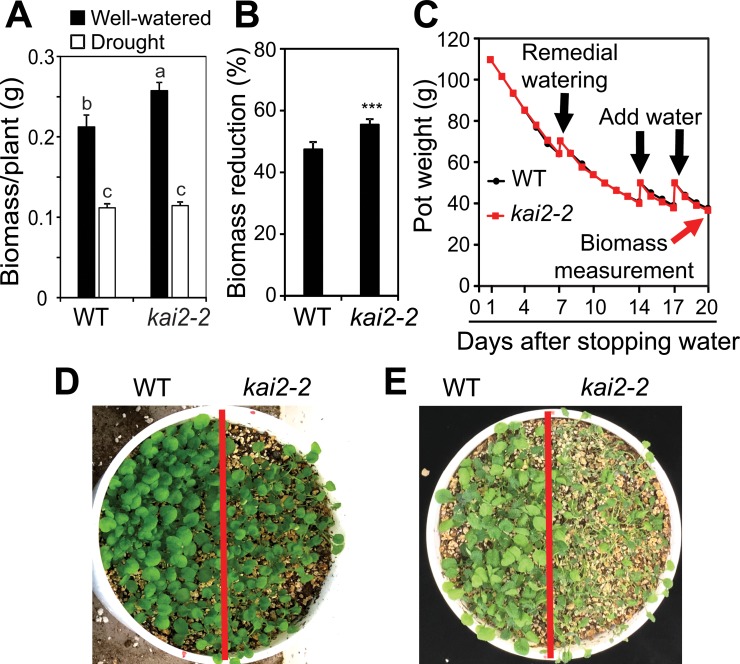
Fig 1. Effects of KAI2 on drought resistance.
(A) Biomass of kai2-2 and WT plants under drought stress and well-watered control (n = 9 biological replicates). The different letters above the error bars indicate significant differences (P < 0.05) in all combinations according to a Tukey's honest significant difference test. (B) Biomass reduction of kai2-2 and WT plants under drought stress relative to respective well-watered control. Data represent the means and standard errors (n = 9 biological replicates). Asterisks indicate significant differences as determined by a Student’s t-test, ***P < 0.001. (C) Averaged pot weights of kai2-2 and WT plants during drought stress (n = 9 biological replicates). Black arrows indicate when water was added to the root growth area in the soil. Red arrow indicates when biomass was measured. (D-E) WT and kai2-2 mutant plants were grown on water-saturated soil for 8 days. Watering was then stopped for 7 days (D) and 14 days (E).

