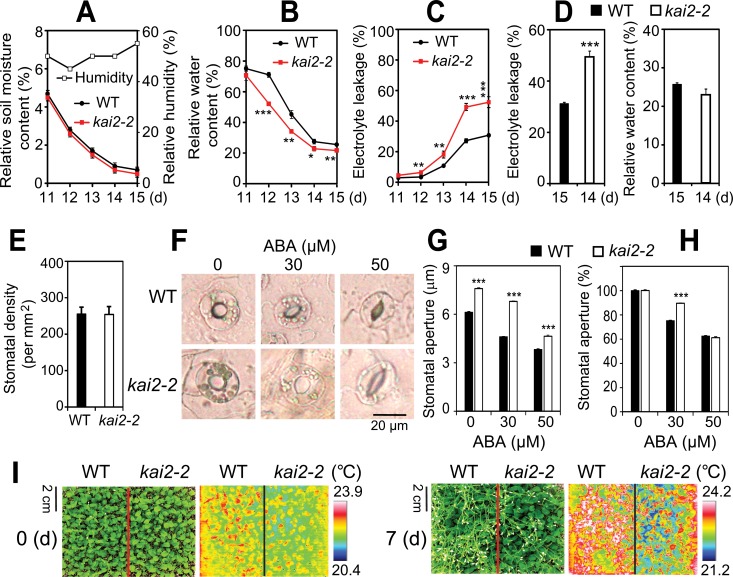
Fig 2. Drought-associated traits of kai2-2 leaves.
(A-C) kai2-2 and WT plants were grown and exposed to drought. At indicated time points, (A) soil relative moisture contents (n = 10) and relative humidity, (B) leaf relative water content (RWC) (n = 4 biological replicates), and (C) electrolyte leakage (n = 4 biological replicates) were determined. (D) Electrolyte leakage (Left) of kai2-2 and WT plants at a similar RWC (Right) during drought treatment (n = 4 biological replicates). Data represent the means and standard errors. (E) Average stomatal density of rosette leaves (abaxial side) from 14-day-old plate-grown kai2-2 and WT plants. Error bars represent standard errors (n = 15 leaves/15 independent plants/genotype). (F) Representative guard cells of rosette leaves from 21-day-old plate-grown kai2-2 and WT plants treated with 0, 30 and 50 μM ABA. (G-H) Average width of stomatal aperture of rosette leaves from 21-day-old WT and kai2-2 plants in the presence or absence of ABA. Aperture width are shown in micrometers (G) or in percentage of the average aperture width obtained from absence of ABA treatment (H). Error bars represent standard errors (n = 5 plants; for each plant the average of nine stomatal measurements from a single leaf was calculated). (I) Leaf surface temperatures of well-watered WT and kai2-2 plants before (0 d) and after a 7-d drought period (7 d). Plants were 21-d-old at the start of water withholding. Common optical camera (Left) and thermal imaging camera (Right) were used to take pictures at the same time. Asterisks indicate significant differences between the genotypes under well-watered control or drought conditions as determined by a Student’s t-test, *P < 0.05; **P < 0.01; ***P < 0.001.

