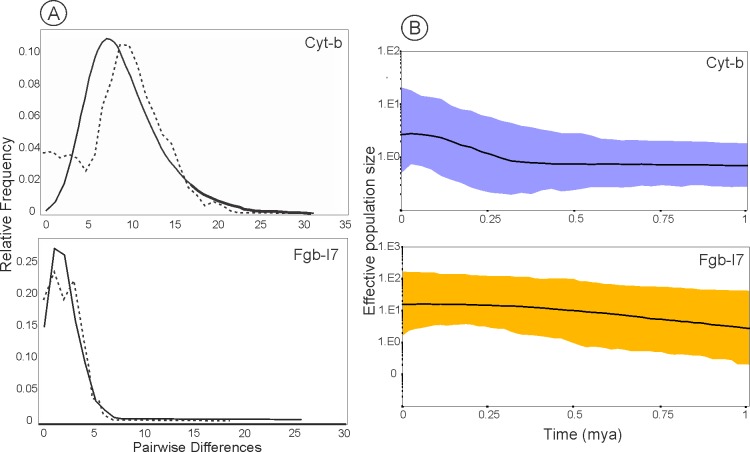
Fig 4. Demographic history of O. nasutus with signatures for population expansion.
A, mismatch distributions of pairwise differences of Cytb and Fgb-I7 haplotypes obtained under a model allowing expansion. B, Bayesian Skyline Plot for Cytb and Fgb-I7 datasets. Bold lines indicate the median of effective population size through time and the coloured lines represent the 95% highest posterior densities over the median estimates along the coalescent history of the species.

