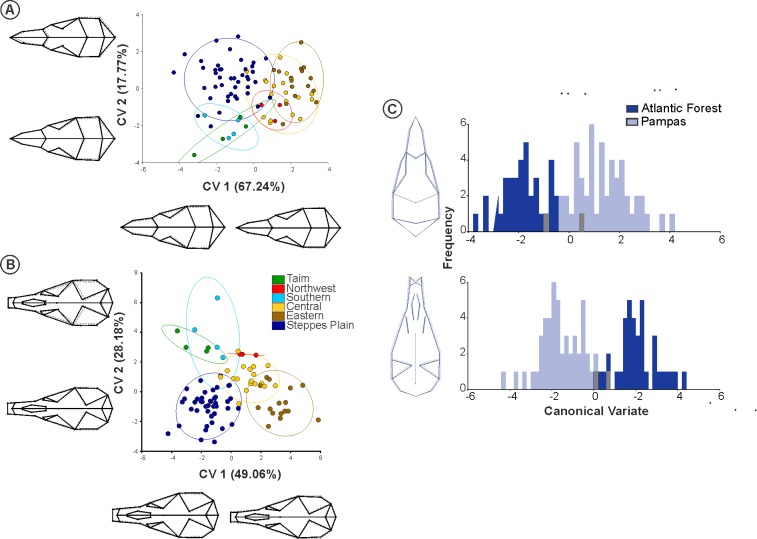
Fig 5.
Scatter plot of the first Canonical Variate axis of the O. nasutus skull at the dorsal and ventral views, with groups following the genetic haplogroups (A, B), and the physiognomies (C). Changes in the shape for each axis are given; solid lines indicate positive scores and dashed lines indicate negative ones.

