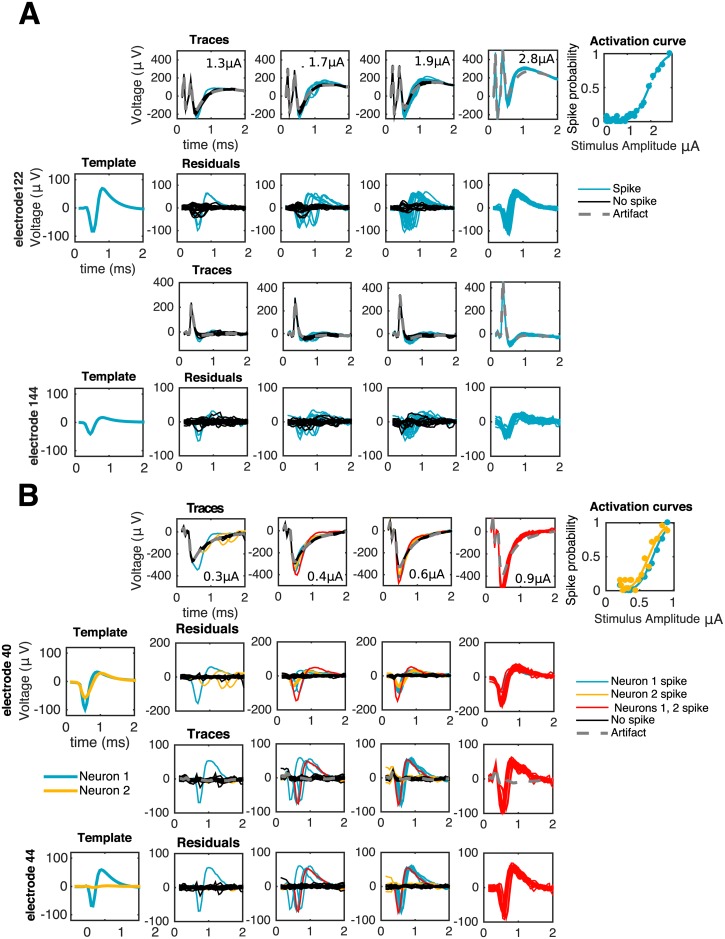
Fig 2. Visual inspection of traces reveals the difficulty of the problem.
First column: templates of spiking neurons. Second to fourth columns: responses of one (A) or two (B) cells to electrical stimulation at increasing stimulation amplitudes as recorded in the stimulating electrode (first rows) or a neighboring, non-stimulating electrode (third rows). If the stimulation artifact is known (gray traces) it can be subtracted from raw traces to produce a baseline (second and fourth rows) amenable for template matching: traces with spike(s) (colored) match, on each electrode, either a translation of a template (A and B) or the sum of different translations of two or more templates (B). As reflected by the activation curves (fifth column) for strong enough stimuli spiking occurs with probability close to one, consistent with the absence of black traces in the rightmost columns.

