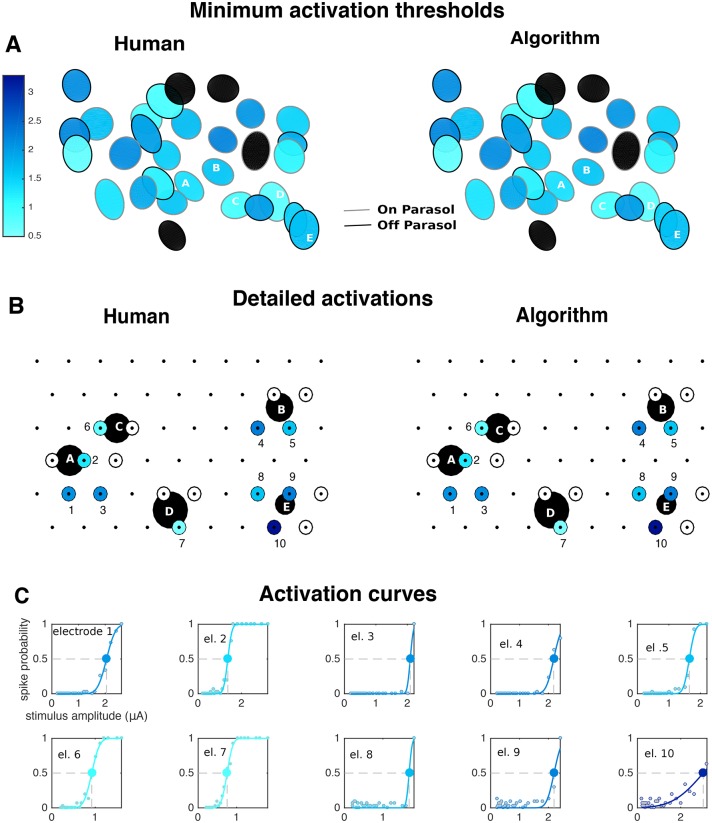
Fig 12. Large-scale analysis of the stimulation of a population of parasol cells.
For each neuron, one or more stimulating electrodes in a neighborhood of neural soma were chosen for stimulation. A Receptive fields colored by the lowest achieved stimulation threshold (black if activation was not achieved). B Inferred somas (big black circles) of the neurons labeled A-E in A), showing which electrodes were chosen for stimulation (small circles) and whether activation was achieved (colors). C Activation curves (solid lines) of the neurons in B for the successful activation cases. Gray and colored dots represent human and algorithm results, respectively, and large circle indicates stimulation thresholds.

