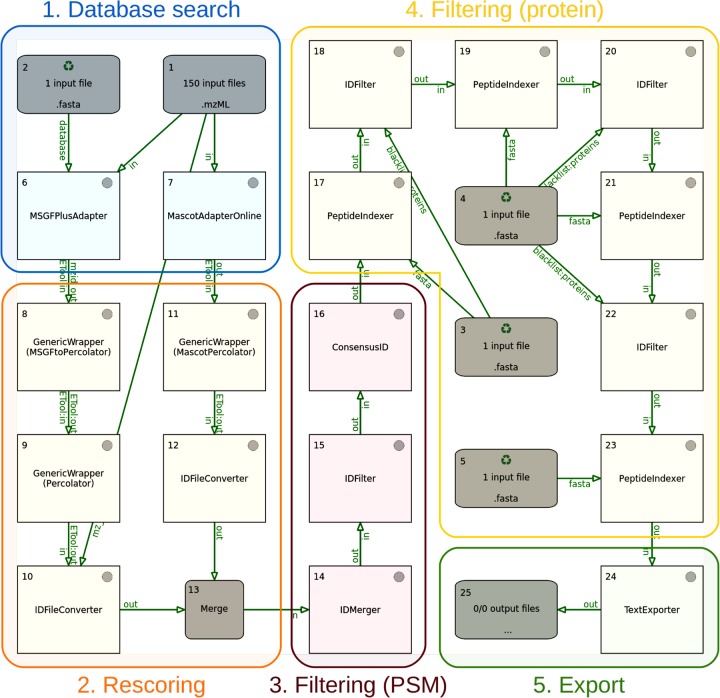
Figure 2.
Proteogenomics pipeline, as displayed in the TOPPAS workflow editor. The different stages of the pipeline are indicated using colored boxes. Additional output nodes, which would be used in practice to capture intermediate results at different stages, have been omitted for simplicity. The input file nodes 1–5 contain the following data: 1, MS2 spectra (mzML files); 2, combined target–decoy sequences (FASTA); 3, contaminant sequences (FASTA); 4, known protein sequences (FASTA); and 5, presumed noncoding sequences (FASTA).

