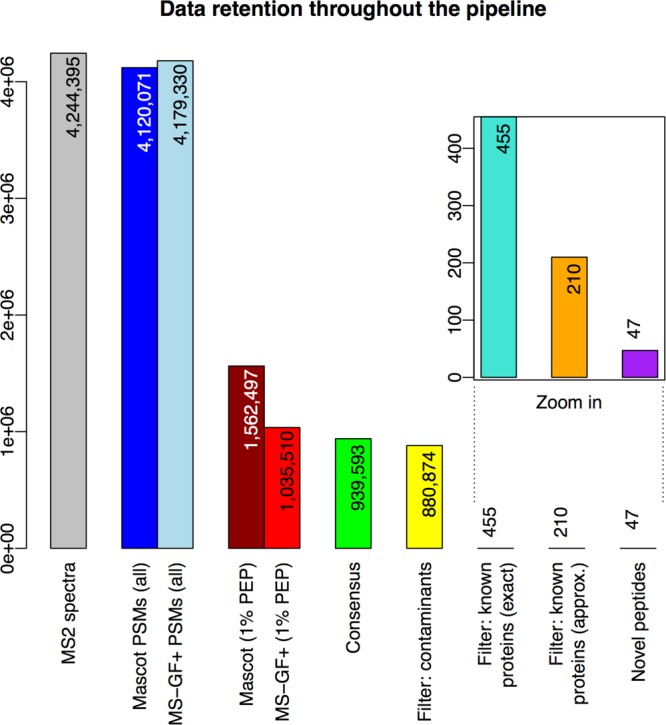
Figure 3.

Data retention throughout the pipeline. The bars show the numbers of “data elements” (spectra, PMSs, and peptides) under consideration as these numbers decrease from the start (left) to the end (right) of the proteogenomics pipeline. In detail, the bars represent the following (node numbers refer to the TOPPAS workflow in Figure 2): “MS2 spectra”, input MS2 spectra in the C-HPP testis data set; “Mascot/MS-GF+ PSMs (all)”, spectra that generated PSMs using either search engine; “Mascot/MS-GF+ (1% PEP)”, PSMs after PSM-level filtering (node 15); “Consensus”, PSMs after ConsensusID (node 16); “Filter: contaminants”, PSMs after filtering for contaminants (node 18); “Filter: known proteins (exact)”, PSMs after filtering for exact matches to known proteins (node 20); “Filter: known proteins (approx.)”, PSMs after filtering for approximate matches to known proteins (final set; node 22); and “Novel peptides”, distinct novel peptides identified by the final set of PSMs.
