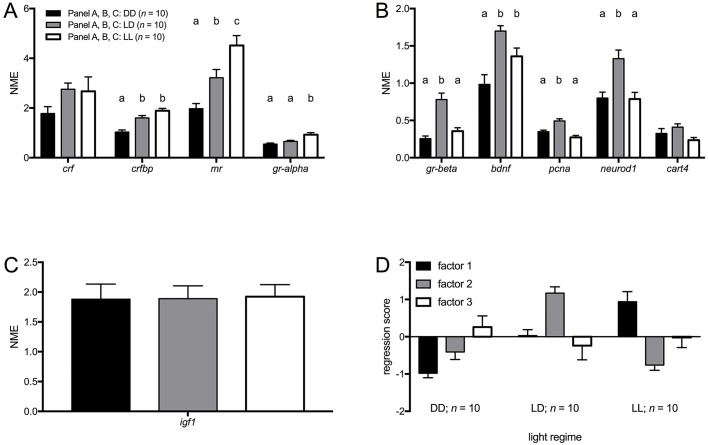
Fig. 1.
Baseline transcript abundance in AB larvae under different light regimes. (A) Baseline transcript abundance [normalised mean expression (NME)+s.e.m.] of genes that loaded on factor 1 (HPI-axis) of the PCA. (B) Baseline transcript abundance [normalised mean expression (NME)+s.e.m.] of genes that loaded on factor 2 [(neuro)developmental genes] of the PCA. (C) Baseline transcript abundance [normalised mean expression (NME)+s.e.m.] of igf1 (loaded on factor 3; growth) of the PCA. (D) Regression scores (mean+s.e.m.) of factors from the PCA. Different letters indicate significant differences (Tukey HSD, P≤0.05) between light regimes following a significant one-way ANOVA.

