
Figure 2. Elemental characterization of mitochondrial granules.
(A) EDX identifies calcium (Ca) and phosphorus (P) enrichment in mitochondria. Areas of a WI-38 fibroblast subjected to EDX (boxed) were imaged prior to spectroscopic analysis. Scale bar is 400 nm. (B) Schematic (not to scale) showing collection of BF and DF CSTET data. (C–E) Scale bar is 200 nm. Sections of BF (top) and DF (bottom) reconstructions display (C) mitochondrial granules (arrowheads), (D) a polyribosome (arrowheads), and (E) a lipid droplet (dr; arrowheads) and a vesicle (v). (F) Color-coded 3D volume rendering (red: high density; blue: low density) showing heterogeneity of density in granules of a WI-38 fibroblast. Granules are presented against backdrops of projected BF volume densities with inverted contrast. (G) Zoom in on the boxed region of F. Scale bar is 50 nm. Sections 10-nm thick from zlTEM tomographic reconstructions are shown for (H) a thin region of a WI-38 fibroblast cell displaying mitochondrial granules and (I) synthetic amorphous calcium phosphate. The synthetic particles shown here were obtained 1.5 min after mixing of calcium and phosphate solutions. Red arrows in panels H and I highlight particles for comparison. Scale bar in H is 50 nm and applies also to I. (J) EDX of synthetic amorphous calcium phosphate (top) compared to an adjacent region of vitrified solution (bottom).
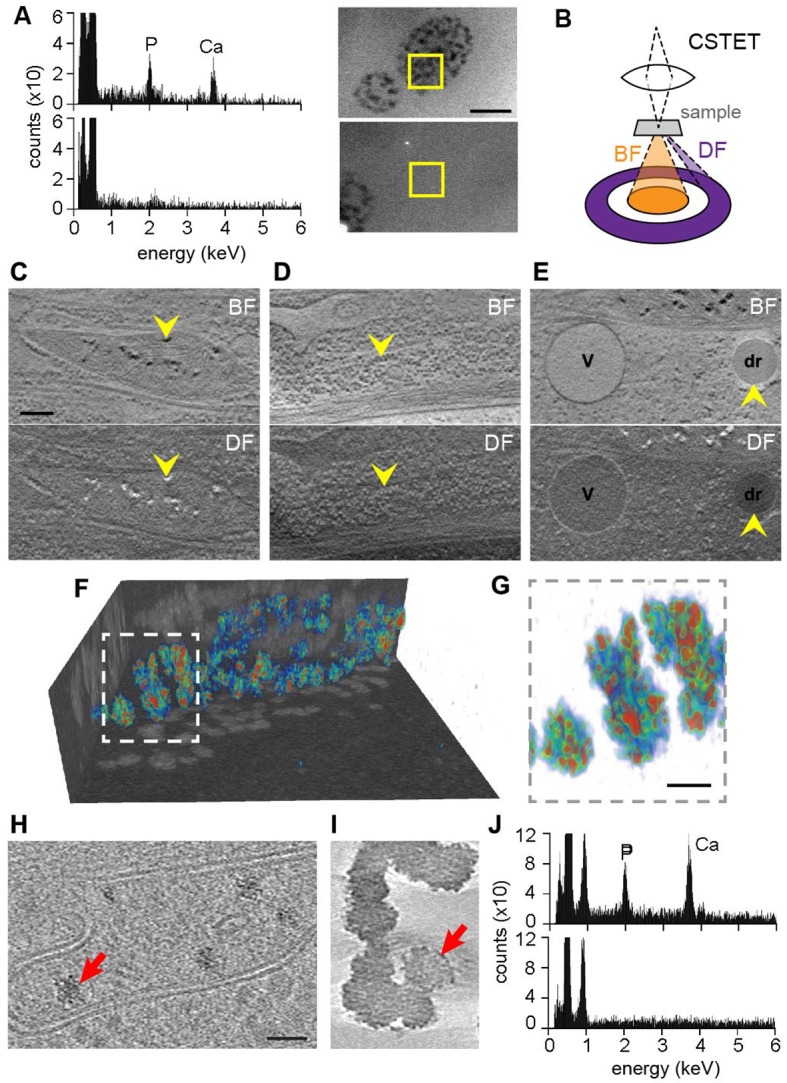
Figure 2—figure supplement 1. Intensity thresholding for quantitative estimation of mitochondrial granule scattering.
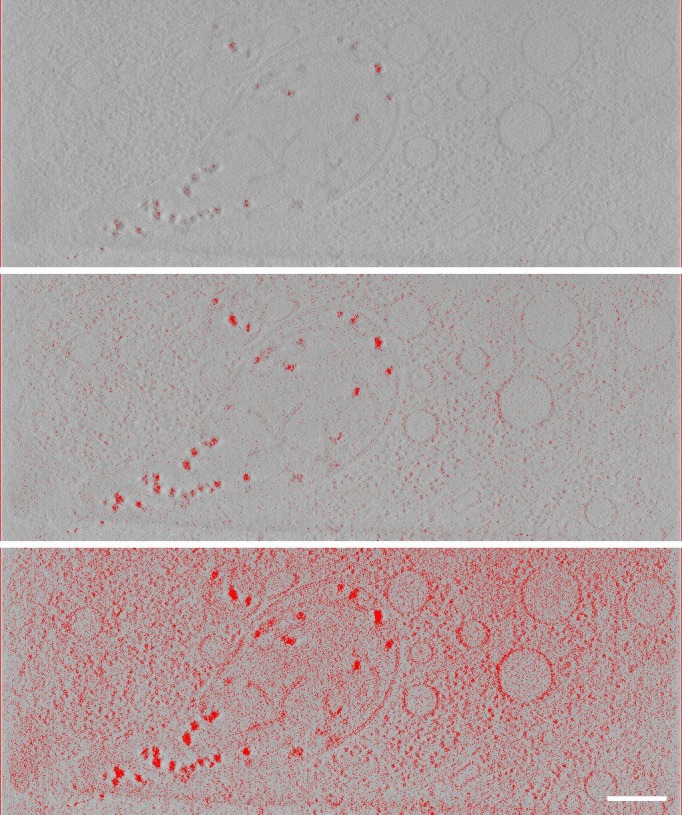
Figure 2—figure supplement 2. Large granules are observed in mitochondria of murine embryonic fibroblasts (MEFs) and are independent of the presence of the mitochondrial calcium uniporter MCU.
