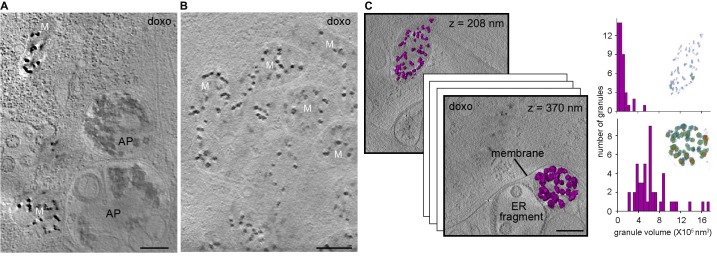
Figure 3. Effect of cell stress on mitochondrial granules.
Sections 30-nm thick from BF CSTET reconstructions of doxorubicin-treated WI-38 cells are displayed. Scale bars are 400 nm. (A) Mitochondria in the vicinity of autophagosomes (AP) (cell is 890-nm thick in this region). (B) Aggregated mitochondria (cell is 1-μm thick). (C) Different granule sizes in two nearby mitochondria separated by a membrane. Granule volumes were segmented using an intensity threshold and are displayed in purple. Height (in nm) from the bottom of the cell (which is 800-nm thick in this region) is in the upper right corner of each section. Histograms of granule sizes are displayed for the two mitochondria. Insets show granules colored as in Figure 1F. Tilt series and reconstruction movies of a doxorubicin-treated cell are in Videos 10 and 11.


