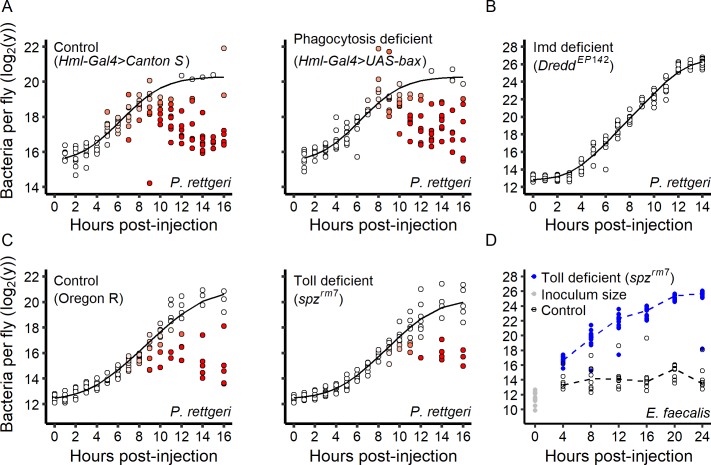
Figure 5. Role of the immune system in the infection dynamic.
(A) Within-host P. rettgeri loads at different times post-injection for wild-type (Canton S) flies and flies deficient in phagocytosis (Hml-Gal4 >UAS GFP; UAS-Bax, Gal80ts). Distinct groups of high-load and low-load flies appear even in absence of phagocytosis. (B) All hosts infected by P. rettgeri suffer high pathogen load in the absence of an Imd-mediated immune response. In these hosts (DreddEP142 mutants), P. rettgeri growth occurs at a rate similar to in vitro bacterial growth (modeled by a Baranyi model, black line). (C) We monitored within-host P. rettgeri loads at different times post-injection for Toll deficient (spzrm7 mutants) and wild-type flies (Oregon R). Distinct groups of high-load and low-load flies appear even in absence of the Toll-dependent immune response. (D) We monitored within-host E. faecalis loads at different times post-injection for Toll-deficient (spzrm7 mutants) and wild-type flies (Oregon R). For this Gram-positive bacterium, despite receiving the same initial inoculum (grey dots), bacterial load differed between mutant and wild-type flies by four hours post-injection (Welsh t-test, df = 22.57, t = 13.01, p-value=5.6e-12). In absence of the Toll pathway (blue dots), all hosts suffered high pathogen burdens. In all panels, each dot represents the bacterial load in a single fly. In Panels A-C, the solid line represent the standard Baranyi bacterial population growth fitted on the white dots (see Materials and methods). The intensity of red in the dots represents the probability that hosts controlled the infection, and whose pathogen burdens are better described by an exponential decrease model (see Materials and methods).

