Figure 6. Up-regulation of the enzymes of the mitochondrial 1C pathway happens before deficient OXPHOS is detectable in mouse heart.
(A) Scheme of 1C pathway. Colored boxes: protein levels; red: increased, grey: not detected or not quantified. (B) Heatmaps showing the fold-change in transcript (left) and protein (right) levels in alphabetical order of L/L, cre and L/L mouse hearts of the 1C pathway; p<0.0001 in≥1 knockout strain. (C) Immunoblot of enzymes of the 1C pathway in total protein extracts from L/L, cre and L/L; Loading: tubulin. (D) Quantification of 1C donor metabolite levels in L/L, cre and L/L. Graphs represent mean ± SEM (*p<0.05, **p<0.01, ***p<0.001). (E) Time point analysis of protein levels of enzymes of the 1C pathway (top), and LRPPRC and VDAC (bottom) in Lrpprc knockout hearts compared to controls. Yellow line: average value of nuclear and mitochondrial encoded OXPHOS complex IV subunits. Adjusted p<0.05, except for VDAC. LRPPRC and VDAC protein levels at the different time points were verified by immunoblotting presented in Figure 6—figure supplement 1.

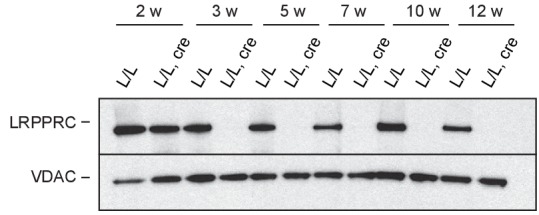
Figure 6—figure supplement 1. Steady-state LRPPRC protein levels at different time points in mitochondrial extracts from Lrpprc L/L, cre and L/L hearts; Loading: VDAC1.