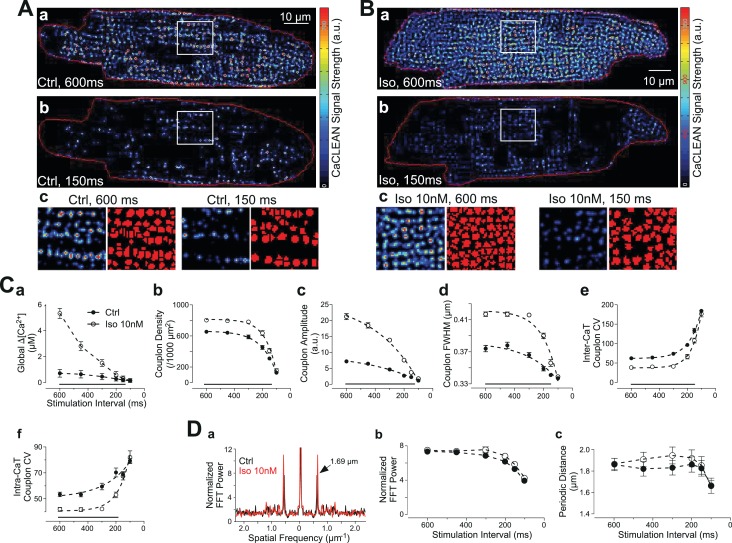
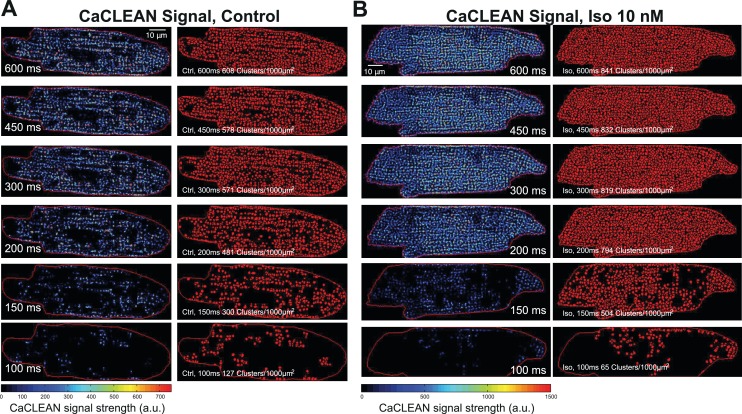
Figure 3. Behavior of ECC couplons at variable stimulation frequencies and during β-adrenergic stimulation.
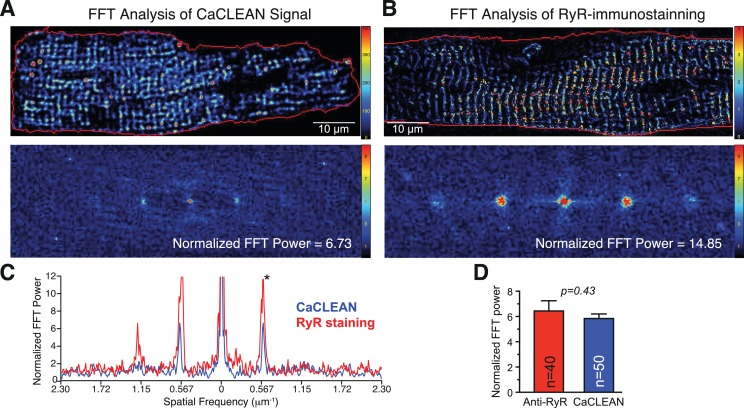
Rat ventricular myocytes were electrically paced into steady state at the stimulation intervals given. (A) The resulting CaCLEAN ECC couplon maps at 600 ms (a) and 150 ms (b) stimulation intervals under control conditions (Ctrl). Subcellular regions highlighted with white boxes were replotted at a high magnification (c) alongside with segmented ECC couplon sites (c, red). (B) Data similar to those in (A) but in a ventricular myocyte following β-adrenergic stimulation (10 nM isoproterenol, 5 min) (Iso). (C) (a) The negative Ca2+ transient amplitude-stimulation frequency relationship for control conditions and following stimulation with 10 nM isoproterenol, here, global refers to the average of the confocal section (b) The density of active ECC couplons. (c) The released Ca2+ amplitudes from individual ECC couplons and (d) the size of these ECC couplons (indicated as full width at half maximum, FWHM) decreases with increasing stimulation frequencies for control conditions (filled symbols) and following isoproterenol stimulation (open symbols); (e) the coefficient of variance (CV) of active ECC couplons increases between consecutive inter-CaT couplons and (f) within individual Ca2+ transients (intra-CaT couplon CV) with increasing stimulation frequencies under control conditions and during β-adrenergic stimulation. Significant differences are indicated by the black lines in the lower parts of the panels. (D) Fast Fourier Transform (FFT) analysis of CaCLEAN maps at increasing stimulation frequencies under control conditions and following β-adrenergic stimulation. Panel (a) exemplifies the power spectra of the FFT analysis; panel (b) displays the normalized amplitudes of the characteristic power peaks (marked with an arrow in a) and panel (c) shows the characteristic spatial distances of those power peaks. For all conditions, at least 23 cells from three different animals were analyzed. Error bars smaller than their symbols were omitted. For statistical details see Figure 3—source data 1.


