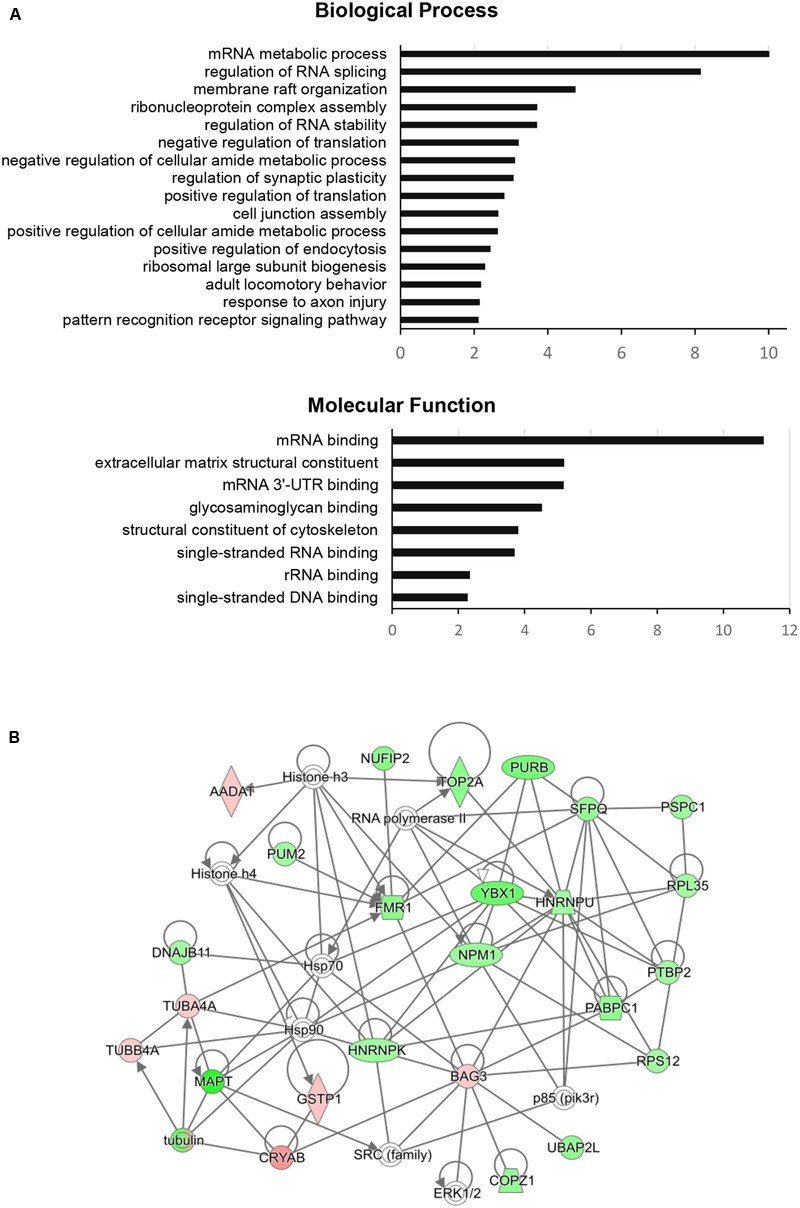
FIGURE 2.

Functional enrichment analysis and FMRP (FMR1)-associated interaction network of significantly changed proteins in aging rats. (A) The GO categories of the most regulated biological processes and molecular functions associated with significantly changed proteins in the aging group. The GO enrichment analysis (Benjamini–Hochberg p-Values < 0.01) was performed using ClueGO-Cytoscape platform (Bindea et al., 2009; Huntley et al., 2015). (B) The protein interaction network of significantly changed proteins centered around FMRP retrieved from IPA analysis (QIAGEN). Green color represents downregulated proteins and red color represents upregulated proteins in the aging group. The protein nodes are connected based on RNA/DNA – interactions (directional lines) or protein – protein interactions (simple lines). Autoregulation is represented by loops. The gene abbreviations are given in the text and Supplementary Table S1.
