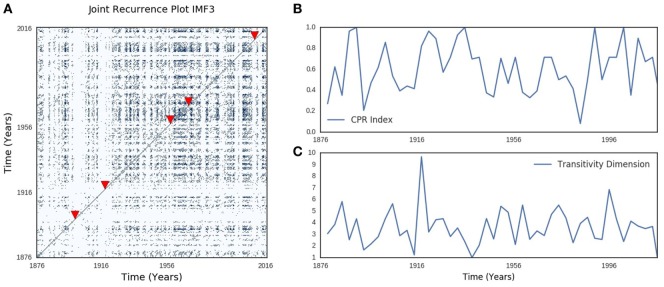
Figure 6.
Southern oscillation (SOI) and sea surface temperature (SST) joint recurrence. (A) shows periodic, quasi-periodic, and chaotic regimes similar to the Lorenz model in the joint recurrence of annual oscillatory components of SOI and SST. The cross-correlation index in (B) shows the time-varying changes in synchronization of SOI and SST, while (C) shows time-varying changes in transitivity. The arrow heads indicate the timing of the first peak of each influenza pandemics. Metrics were calculated for 36-month windows that spanned 18 months before and after the first peak.

