Figure 3.
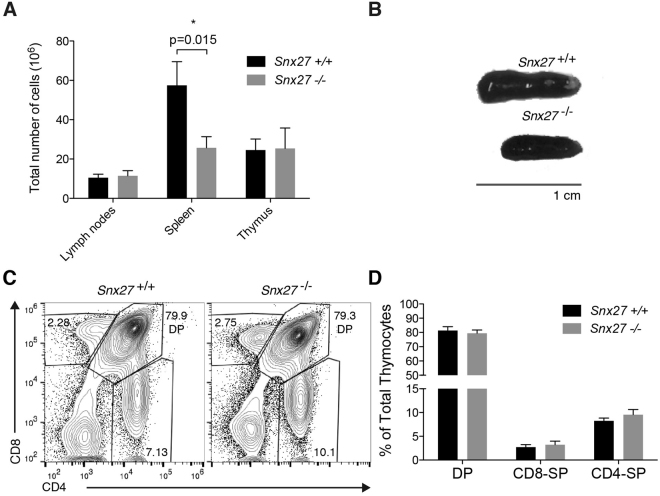
Analysis of T cell development in WT and Snx27 −/− mice. (A) WT and Snx27 −/− mice littermate-matched pairs of mice were sacrificed and total cellularity recorded of the thymus, spleen and lymph nodes. Data shown as mean ± SEM (*p < 0.05; paired t-test; n = 7). (B) Spleen from WT and Snx27 −/− mice littermate-matched pairs are shown for size comparation. (C,D) Thymocytes from WT and Snx27 −/− littermates pairs were stained for CD4 and CD8 and analyzed by flow cytometry. (C) Representative flow cytometry plots. (D) The percentage of total double-positive (DP, CD4+ CD8+) and single positive (SP, CD4+ CD8− or CD4−CD8+) thymocytes was calculated. Data shown as mean ± SEM (*p < 0.05; paired t-test; n = 7).

